 |
| image from http://brucekrasting.com/ |
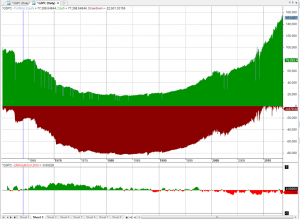
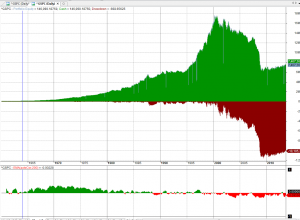
Let us consider two possible ways to trade the SP500.
1. If the index falls today, we buy tomorrow at the open. This is a “mean-reversion” strategy.
2. If the index rises today, we buy tomorrow at the open. A “follow-through” strategy.
From the graphs below, we can see that neither of these strategies worked well from 1960 to today.
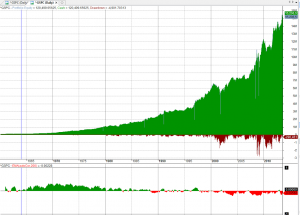
Let’s introduce a qualifier that will tell us which strategy to trade at what time.
We will try the most basic one: The correlation between today’s return (close to yesterday’s close) to the previous day’s return. If it is negative we ‘ll use a contrarian logic. If the correlation is positive we ‘ll use a momentum logic.
The indicator of choice is the 2-period Relative Strength Index (RSI).
So if correlation between yesterday’s and today’s return is less than zero we buy on a correction. Otherwise we buy on strength. We trade at the next Open.
Could you provide statistics on the trades ?
Thankseb
Is there any chance to get tradestation code for your setups? Please:)
Rick
I did not provide stats since this is just a starting point for developing a trading model and is based on a non-tradable Index. If we could trade the Index itself (Yahoo:^GSPC) with a $10 commission (unrealistic in the older days), starting with $100,000, these would be the stats:
Ending capital 14729949.9
Net Profit 14629949.9
Net Profit % 14629.95%
Exposure % 43.54%
Net Risk Adjusted Return % 33598.65%
Annual Return % 9.74%
Risk Adjusted Return % 22.36%
Total transaction costs 29780
All trades 1489
Avg. Profit/Loss 9825.35
Avg. Profit/Loss % 0.35%
Avg. Bars Held 4.95
Winners 789 (52.99 %)
Total Profit 40647125.81
Avg. Profit 51517.27
Avg. Profit % 1.55%
Avg. Bars Held 5.82
Max. Consecutive 11
Largest win 954706.82
# bars in largest win 6
Losers 700 (47.01 %)
Total Loss -26017175.91
Avg. Loss -37167.39
Avg. Loss % -0.99%
Avg. Bars Held 3.98
Max. Consecutive 9
Largest loss -1232294.78
# bars in largest loss 20
Max. trade drawdown -2373806.04
Max. trade % drawdown -22.90%
Max. system drawdown -2631919.2
Max. system % drawdown -26.20%
Recovery Factor 5.56
CAR/MaxDD 0.37
RAR/MaxDD 0.85
Profit Factor 1.56
Payoff Ratio 1.39
Standard Error 1548134.06
Risk-Reward Ratio 0.13
Ulcer Index 4.73
Ulcer Performance Index 0.92
Sharpe Ratio of trades 1.3
K-Ratio 0.0175
I wish I could help but I have no experience and do not own Tradestation. It should be easy to translate the code, though.
I think this is the equivalent EL code (it could be more elegant maybe but it seems to work)
Input:
ContrRSILow(20),
ContrRSIHigh(70),
MomRSILow(60),
MomRSIHigh(50);
Variables:
BuyContr(False),
SellContr(False),
BuyMom(False),
SellMom(False),
AutoCor(0),
Dayreturn(0);
Dayreturn = RateofChange(Close,1);
AutoCor = Correlation(Dayreturn, Dayreturn[1],22);
if RSI(close, 2) < ContrRSILow then BuyContr = True else BuyContr = false;
if RSI(close, 2) > ContrRSIHigh then SellContr = True else SellContr = false;
if RSI(close, 2) > MomRSILow then BuyMom = True else BuyMom = false;
if RSI(close, 2) < MomRSIHigh then SellMom = True else SellMom = false;
if AutoCor < 0 and BuyContr = True then buy this bar close; //Buy the Contrarian signal
If AutoCor > 0 and BuyMom = True then Buy this bar close; //Buy the momentum signal
If AutoCor < 0 and SellContr = True then sell this bar close; //Sell the contrarian signal
if AutoCor > 0 and SellMom = True then sell this bar close; //Sell the momentum signal
Thank you CZ.
Should the 2 Amibroker equity charts at the top (mean-reversion and momentum) not be opposite of each other? Or is one log, other linear?
No problem. Happy to give back!
Why is it Correlation 22? Optimized? What's the time series function in R? acf? can someone show an example?
James,
BuyContr=RSI(2)<20;
SellContr=RSI(2)>70;
BuyMom=RSI(2)>60;
SellMoM=RSI(2)<50;
These 2 systems are not exactly symmetrical.
Anonymous,
The 22-day (one month) correlation was chosen arbitrarily.
Need use SellShort instead of Sell for EL
Input:
ContrRSILow(20),
ContrRSIHigh(70),
MomRSILow(60),
MomRSIHigh(50);
Variables:
BuyContr(False),
SellContr(False),
BuyMom(False),
SellMom(False),
AutoCor(0),
Dayreturn(0);
Dayreturn = RateofChange(Close,1);
AutoCor = Correlation(Dayreturn, Dayreturn[1],22);
if RSI(close, 2) < ContrRSILow then BuyContr = True else BuyContr = false;
if RSI(close, 2) > ContrRSIHigh then SellContr = True else SellContr = false;
if RSI(close, 2) > MomRSILow then BuyMom = True else BuyMom = false;
if RSI(close, 2) < MomRSIHigh then SellMom = True else SellMom = false;
if AutoCor < 0 and BuyContr = True then buy this bar close; //Buy the Contrarian signal
If AutoCor > 0 and BuyMom = True then Buy this bar close; //Buy the momentum signal
If AutoCor < 0 and SellContr = True then SellShort this bar close; //Sell the contrarian signal
if AutoCor > 0 and SellMom = True then SellShort this bar close; //Sell the momentum signal
Well, I was suffering through your drought of posts and then this post. If this is the product of a drought then I can survive another drought. Well done Sanz!
One observation on your logic… this looks like a "poor man's Hurst exponent."
Hello, could you explain why I get zero in AutoCor?
Where should I look? What may influence on it?
Crakes,
Thank you very mush for the encouraging comments! And, yes you could say that this is a poor man's Hurst as far as attempting to classify the SP500 timeSeries as mean reverting or trending..
How can you buy or sell by open price while the day has not yet been closed?
You may do it only by Close price or Open price of the next day: Buyprice=Sellprice=Ref(O,1);
And this code is only for backtesting.
Akros,
The code is correct and does not look forward.
SetTradeDelays(1,1,1,1);
BuyPrice=SellPrice=O;
This code instructs the backtester to trade on Open on the Next day After the signal.
Please refer to http://www.amibroker.com/guide/afl/afl_index.php?m=2 as well as many examples here
http://www.amibroker.com/library/list.php
Sorry Sanz, but the principle of code working is so that after closing candle, in the end of the day, rule gives signal by open price of current candle.
The problem is that you have no confidence that Close price would be better than Open of the day. And only in the next day your order with old open price will be put in the market.
Am I clear?
Am I right? This Ami code should be corrected…
Akros,
The way the code works is that it gets a signal at the end of day t and buys, sells or holds on day t+1. So if at the end of the day on Monday it gets a buy signal, it buys at the open on Tuesday.
Feel free to backtest the code in Amibroker and check the results manually. Please let me know if you find problems.
Dear Sanz, I have already checked this code in my Ami 5.30.
And I receive Open price of the day when signal appears. Not in the next day. That's why I wrote you.
And in Explore mode I see that ROC is changing from -2 to 2: -2, -1, -0,0,1,2.
AutoCor is always -1, -0, 0 or 1.
Are they correct? Shouldn't they be with decimal point?
This comment has been removed by the author.