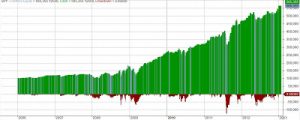
Let’s try the good old strategy for RSI(2) mean reversion.Buy on Rsi(2)<30Sell on Rsi(2)>60Execution is on the Open of the next day.This is what trading the SPY etf looks like. How about using the same signals and selling 10, 1-point away from the floor price, front month Puts.* Again, we sell 10 Puts right below …
Archives for January 2013
Dis-advantages of the Retail Investor Part 1:Follow The Money

Part 1:From Odyssey Book XII: “‘So far so good,’ said she, when I had ended my story, ‘and now pay attention to what I am about to tell you […]First you will come to the Sirens who enchant all who come near them. If any one unwarily draws in too close and hears the singing of the …
Read moreDis-advantages of the Retail Investor Part 1:Follow The Money
CBA – Quick test drive

Inspiration strategy: http://empiritrage.com/2013/01/21/correlation-based-allocation/ Quoted from Empiritrage.com:“We propose a model that is designed to identify bull-market and bear-market regimes. We examine correlation between stocks and bonds as a signal. Our hypothesis is that negative correlation between long bonds and stocks represents a bear-market regime, and a positive, or non-existent correlation, reflects a bull market regime.The model calculates …
Visualizing Data
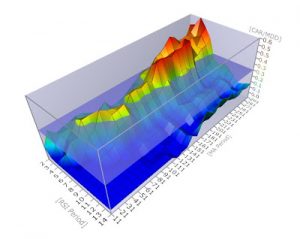
I have been looking for ways to visualize what happens to a trading system when we shift it’s parameters. I bumped into this little free tool that might help us do that. Let’s start from the beginning: We will start with a hypothetical mean reversion system and check visually what happens as the parameters change.We …
Mon AMMI

No, it’s not french and it’s not the movie.It’s a fast-N-rough “Adaptive Multi strategy Multi Instrument” model. Let’s assume we want to trade mean-reversion: If price moves down we buy, if it moves up we sell. Possible Indicators from the blog-o-sphere:RSI(2),RSI(3),RSI(4)DV2 here and hereBSI here or hereBoilingerBandsCRSI hereTD9 here Question 1: Which Indicator to use? One …