Each month we buy at the Open of the first day of the month and sell at the close of the last day of the month.
Here’s the average profit loss for the S&P500 Etfs, SPY (yahoo:SPY). Data from 1993.
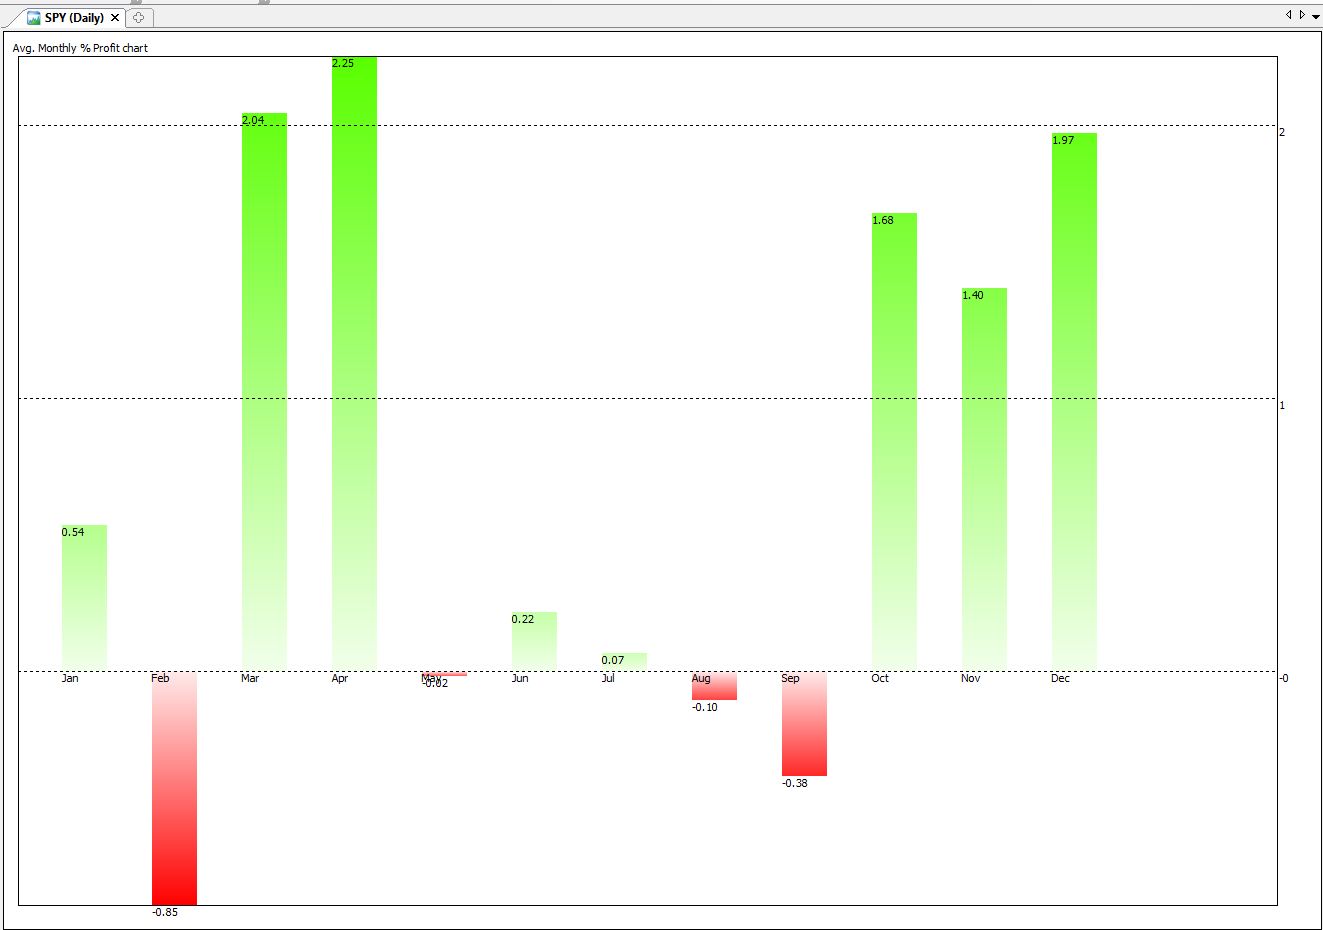
This chart shows that for example if we bought every December @ the open and sold at the end of the month @the Close, we would average a 1.97% profit.
But is average profit, alone, a good indication of profit loss potential?
One way to look at this is his:
Mr. X., a french expat and a bon viveur, wakes up and just feels like gambling. He takes a trip to the nearby casino. We ‘ll call it the Casino “Royale”. He enters the lobby and is presented with 12 different slot machines.

 The answer to both is the Kelly criterion: f=(bp-q)/b
where:
f* is the fraction of the current bankroll to wager;
b is the net odds received on the wager (“b to 1”); i.e., if you play $1, how much do I win/loose.
p is the probability of winning;
q is the probability of losing, which is 1 − p.
So again, here’s the SPY chart using Kelly instead of Average Profit.

NumOfwins[12]: 14 – i.e., 14 Decembers were wins
NumOfloss[12]: 6 – i.e., 6 Decembers were losers
AvgWin[12]: 2.6075
AvgLoss[12]: -2.02946
Certainty[12]: 70 – i.e. 14 winning Dec’s out of 20 = 70% winning prob.
EXPECT[12]: 1.21641
KELLY[12]: 0.466505


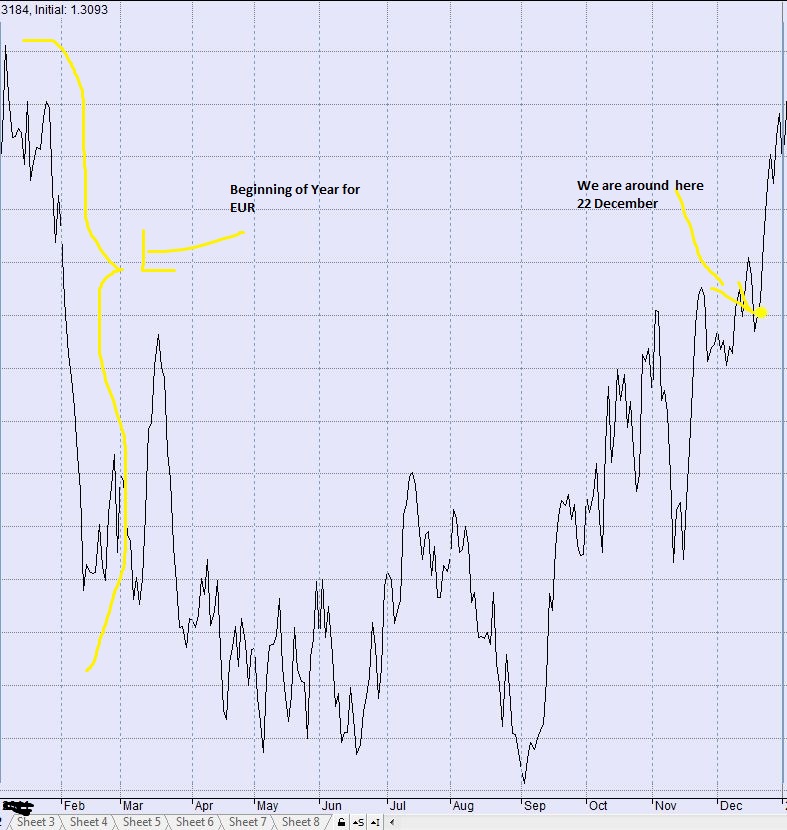
Approximate continuous “averaged” EURO graph Jan. to Dec
Aidan O'Mahony has coded a simple strategy based on this post and the SP500 seasonal month statistics. It's written in Python, using the Quantopian free backtester:
https://www.quantopian.com/posts/buy-and-hold-of-spy-on-profitable-months