What happens, then once a strategy becomes public domain? Do they loose their edge?
All tests are performed on a set of 20 ETFs:
DIA,EEM,EFA,EWH,EWJ,EWT,EWZ,FXI,GLD,ILF,IWM,IYR,QQQQ,SPY,XHB,XLB,XLE,XLF,XLI,XLV
Tthe strategy can hold up to 10 ETFs at any time.
Strategy 2: MDD / MDU
The rules:
1. ETF is above MA(200)
2. ETF is below MA(5)
3. ETF has closed lower 4 days out of the last 5.
BUY on the close of the day these criteria are met.
SELL on the close of the day the ETF closes above its MA(5).
The exact opposite for SHORT/COVER.
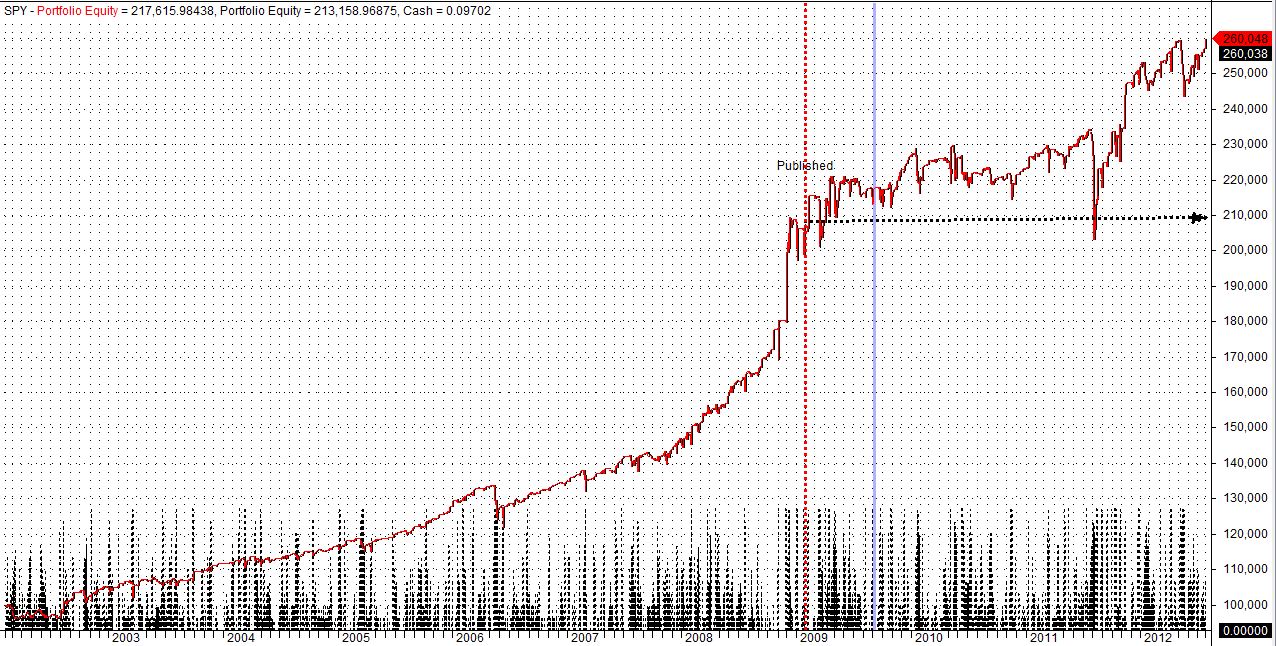
“In-Sample” 2002-2009: CAR/MDD=1.22 .
“Out-of-sample” 2009-2012: CAR/MDD=0.55
a. Simple version, 20 ETFs – Jan 1,2002 – Aug.1,2012
# winners = 1351 (71.07%), # losers = 550 (28.93%)
# winners = 482 (68.08%), # losers = 226 (31.92%)
# winners = 1382 (72.70%), # losers = 519 (27.30%)
# winners = 493 (69.63%), # losers = 215 (30.37%)
Not impressed? You should be…
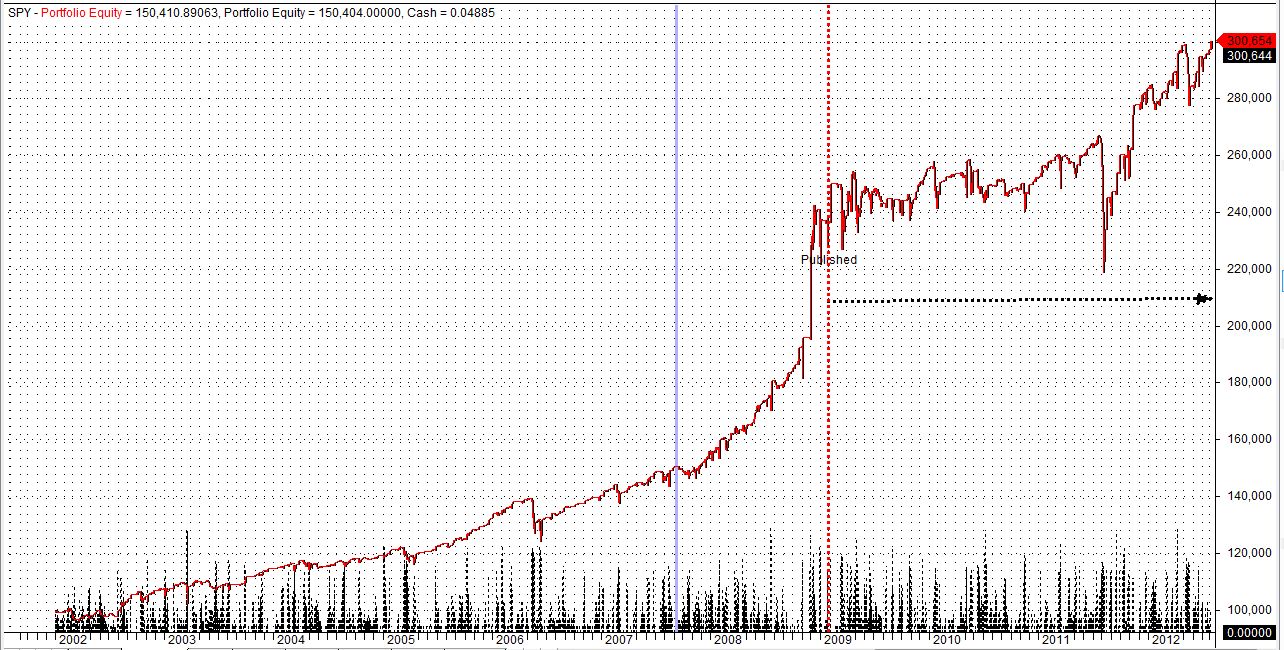
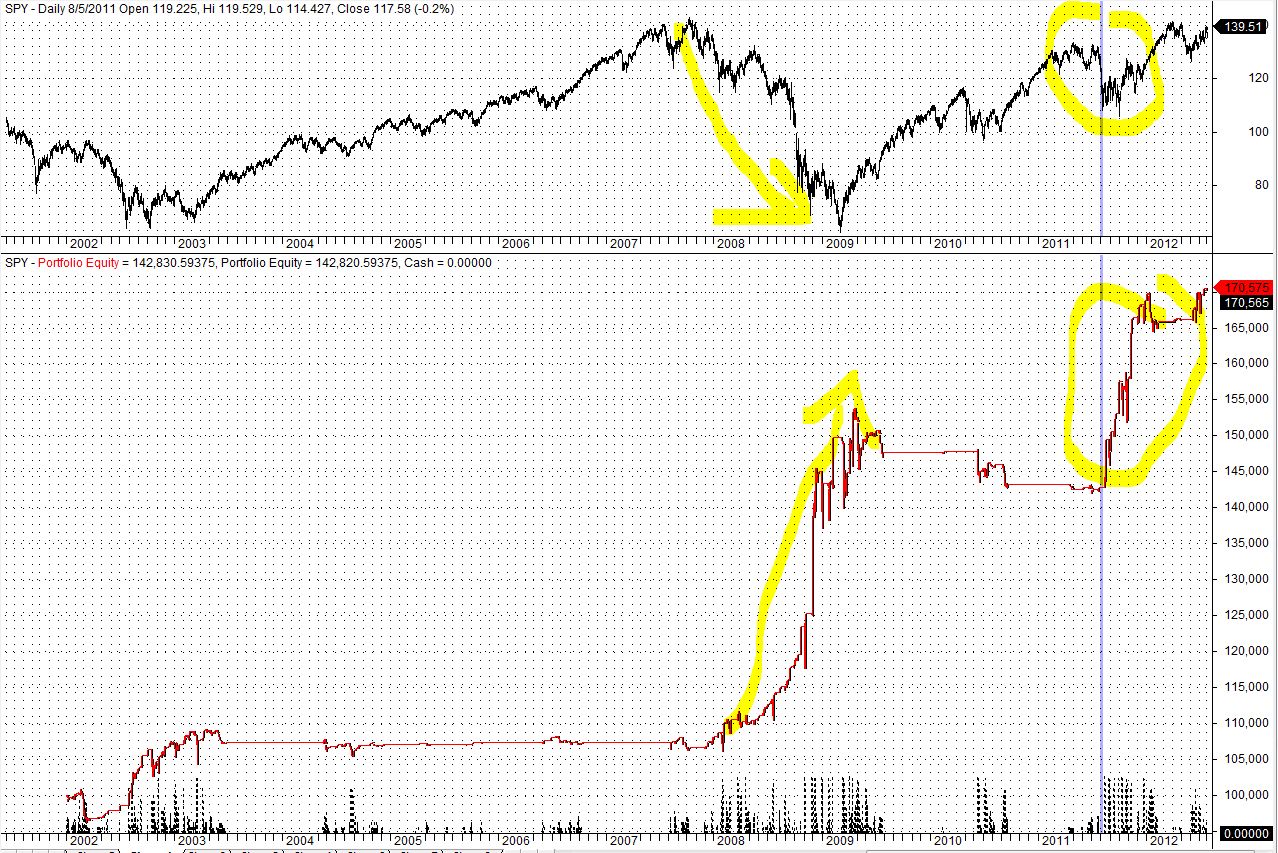
Although you might not be impressed, there is a very impressive and potentially usefull aspect of this strategy. Let’s zoom in on the 2008-2009 crash:
While SPY (SP500 ETF) crashed 52%, the strategy made 48%.

That’s a time when most managers were wiped out. It turns out this “tail risk” protection came purely from the SHORT trades.
Let’s break down the equity to long trade equit and short trade equity:
Equity due to LONG trades (flat due to 200 Mov. Average filter)
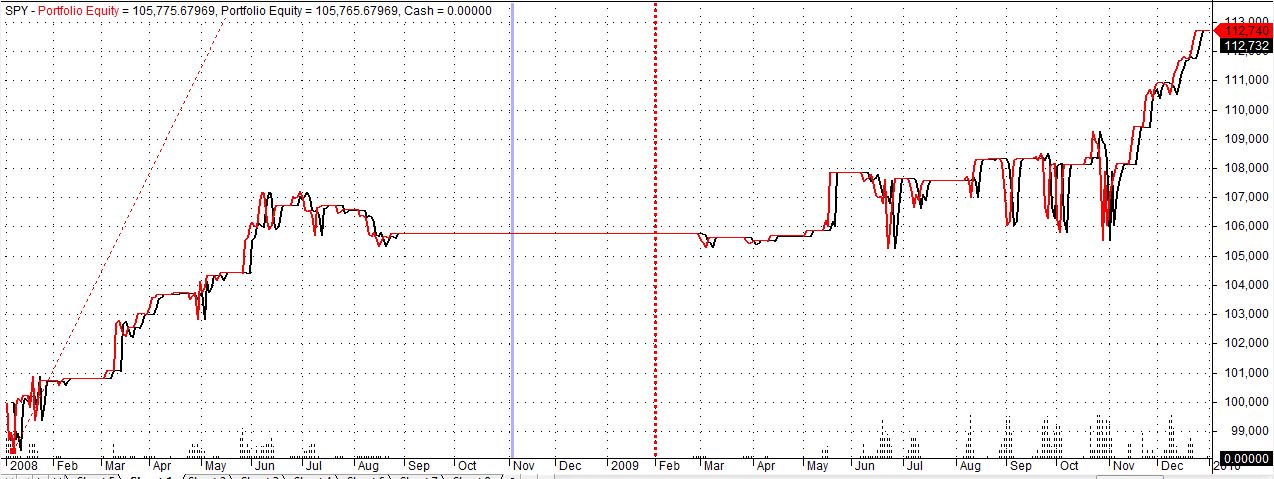
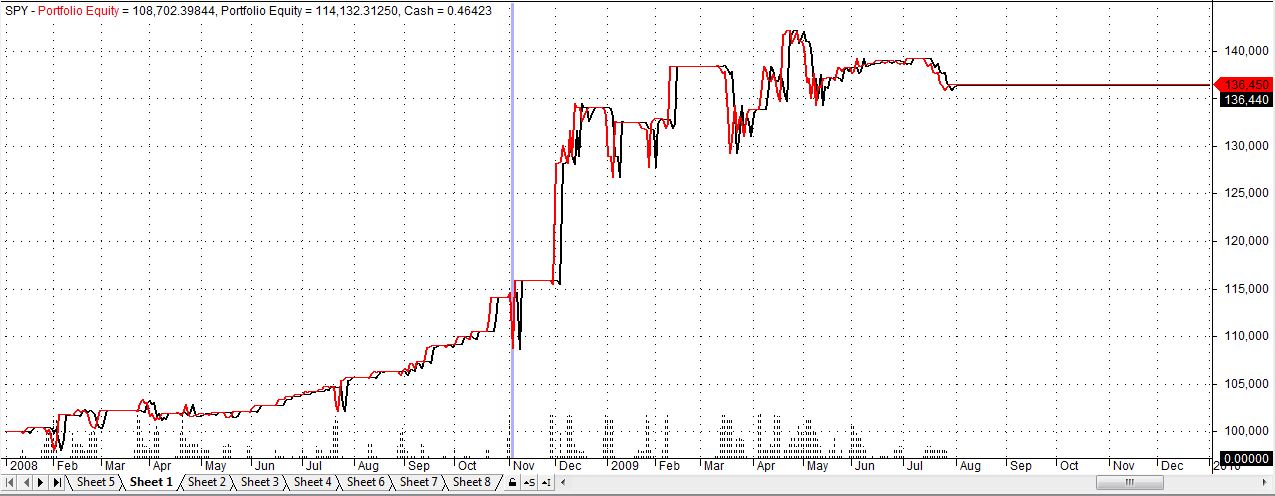
And here’s the Equity for the strategy Short positions only, from 2002 till 2012. Notice the Augoust 2011 mini crash that did damage to most intelligent strategies? This is what I call cheap “tail risk” insurance. This is the effect that most managers want when buying VIX futures and have to accept the roll-over cost.
The Short only stats 2002-2012:
Profit = 70574.62 (70.57%), CAR = 5.17%, MaxSysDD = -11885.08 (-7.72%), CAR/MDD = 0.67,
# winners = 480 (69.87%), # losers = 207 (30.13%)
//Code by VangelisM. (aka – sanzprophet )
//Part of Code taken by afl from Library – Paul’s “Connors TPS – ETFs.afl”
Leave a Reply