In this article we look at ways to enhance Harry Brown’s Permanent Portfolio

It’s not just cars. It’s investment strategies, too.
Vintage strategies are often simple, easy to execute and provide amble ‘out-of-sample’ data. In other words one can see how they performed in real life years after they have been proposed. And like the VW bug, they are “safe” choices. Tried and true.
Can you imagine a 1965 VW running in the Autobahn?
Although the essence counts for a lot, for the car to survive at today’s highway speeds the tech needs to be up to date.
So let’s take my favorite oldie and bring it up to speed:
Harry Browne’s Permanent Portfolio investment strategy.From Investopedia:
… Browne believed that each of the aforementioned four asset classes would thrive in one of the four possible macroeconomic scenarios that exist.
- Stocks would thrive during periods of economic prosperity.
- Bonds would do well in deflation and acceptably well during periods of prosperity.
- Gold during periods of high inflation would rapidly increase in value as the only true defense against a deteriorating currency.
- Cash would act as a buffer against losses during a routine recession or tight-money episode, and would act well in deflationary times.
So let’s see how it has performed.
The original rules:
25% in a stock market Index (SP500)
25% in Treasuries.
25% in Gold.
25% in Cash or similar.
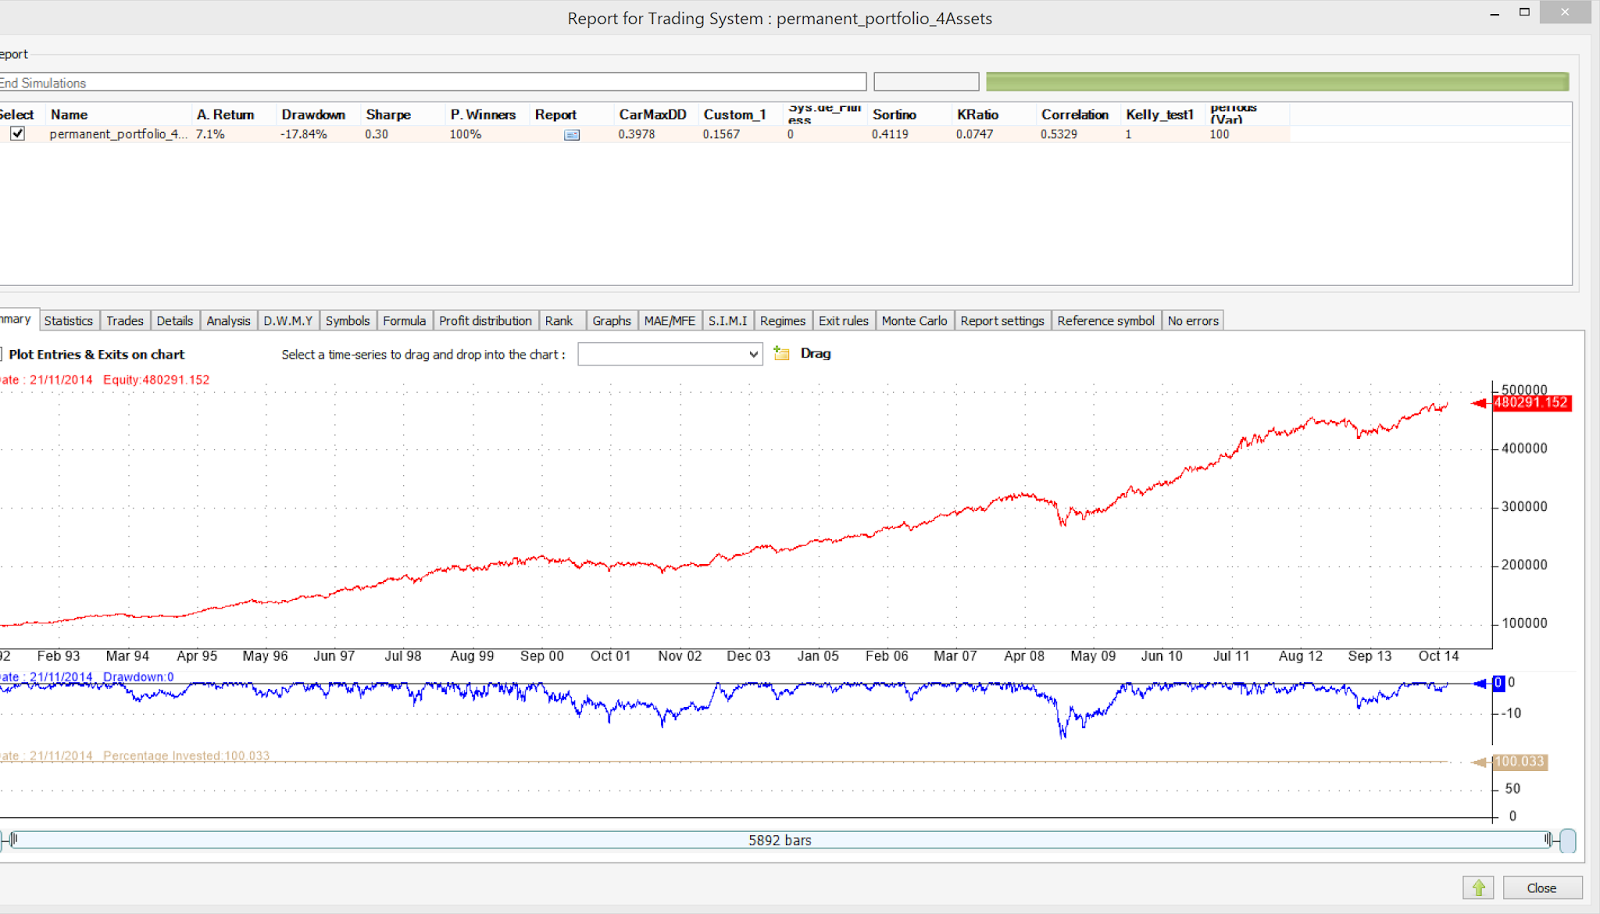
Not bad. Annual return is 7.1% and maximum draw-down comes in at 17.84% since 1992.
For a far more detailed analysis of the so called “PP” you can see Gestaltu’s excellent “PP Shakedown” series as well as Scott’s Investments analysis. There are many other articles and analysis that serve as inspiration to this article.
Building a new investment strategy.
Let us attempt to build upon this wonderful portfolio and create a new strategy: We will call it “The Bug”.
We start by applying some recent portfolio heuristics. All further rules assume monthly rebalances.
1. Volatility Targeting per Asset
If an asset exhibits historical volatility above a threshold, we cut it down in size as to reduce risk to the overall portfolio.
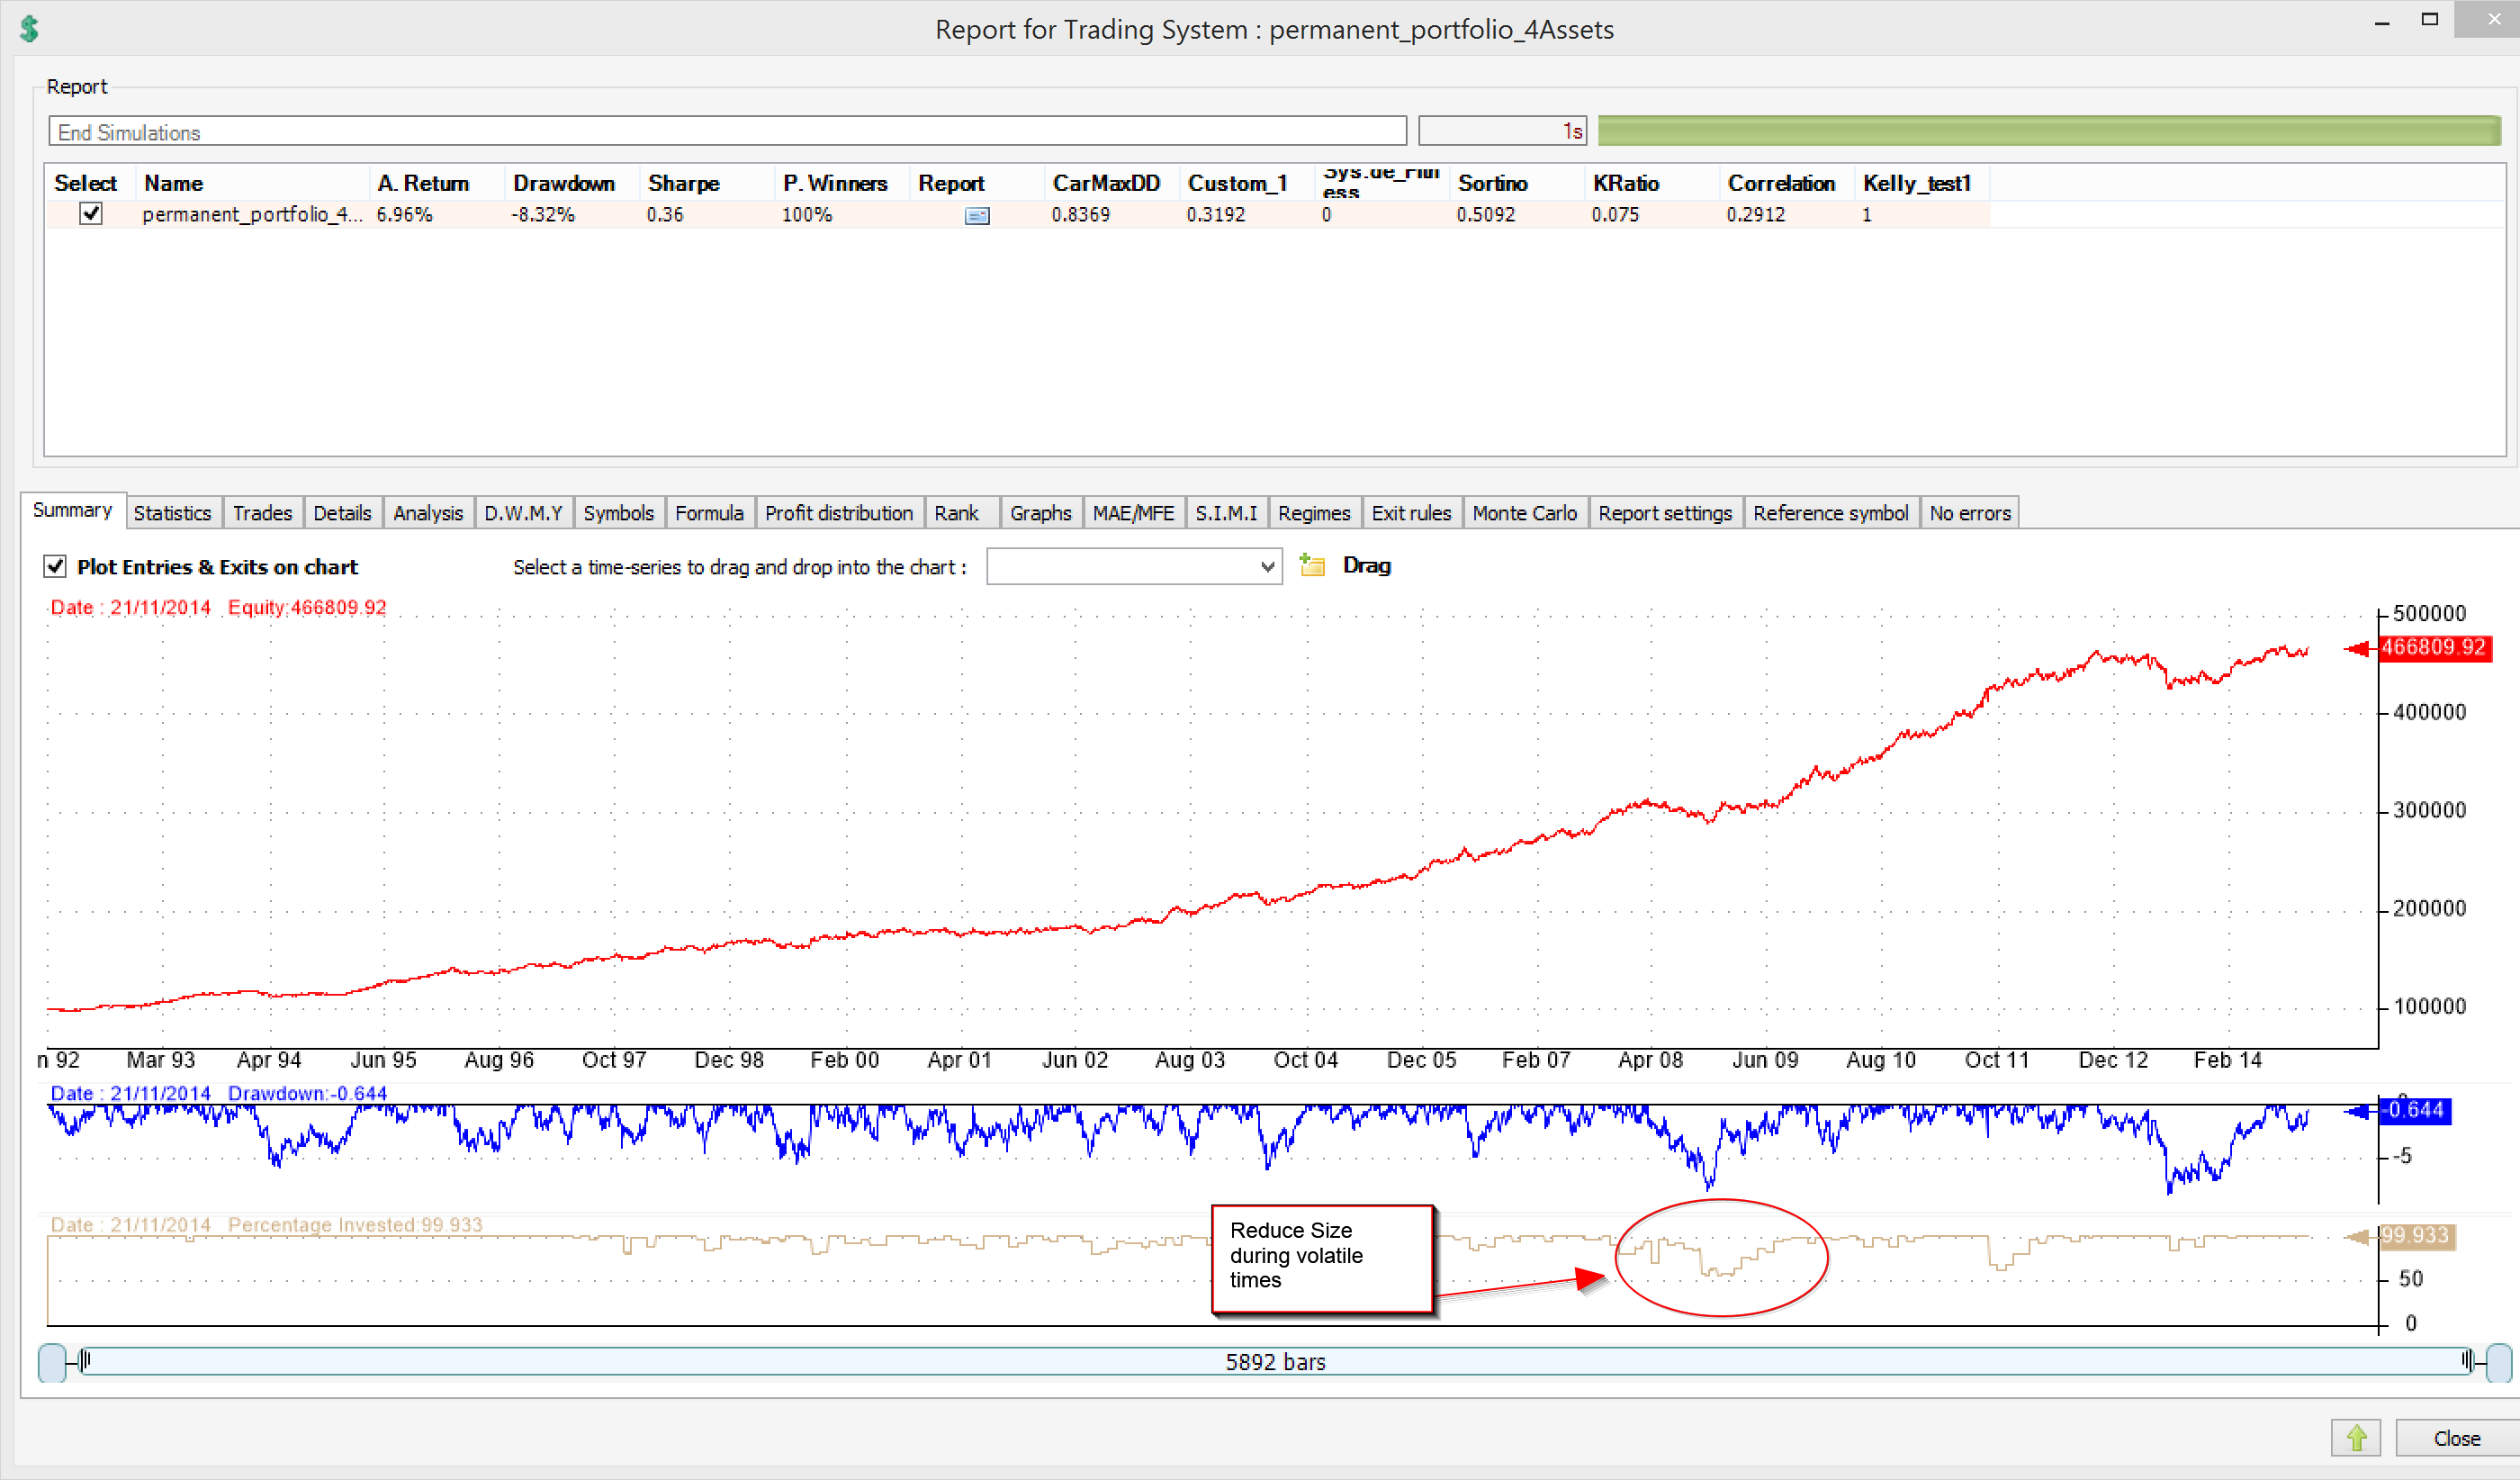
This decreases annual returns but also limits drawdown to under 9%. Overall, risk adjusted returns benefit. CarMDD is at 0.8.
2. Momentum
Instead of trading the top best performers, we will identify the single worst performer. We will decrease funds invested in that asset and distribute those funds to the rest. So if gold underperforms all other assets, we will sell some gold, divide the proceeds in three and buy equal amounts of the SP550 index, Treasuries and Cash.
Let’s try by pulling 15% of equity from the worst asset.
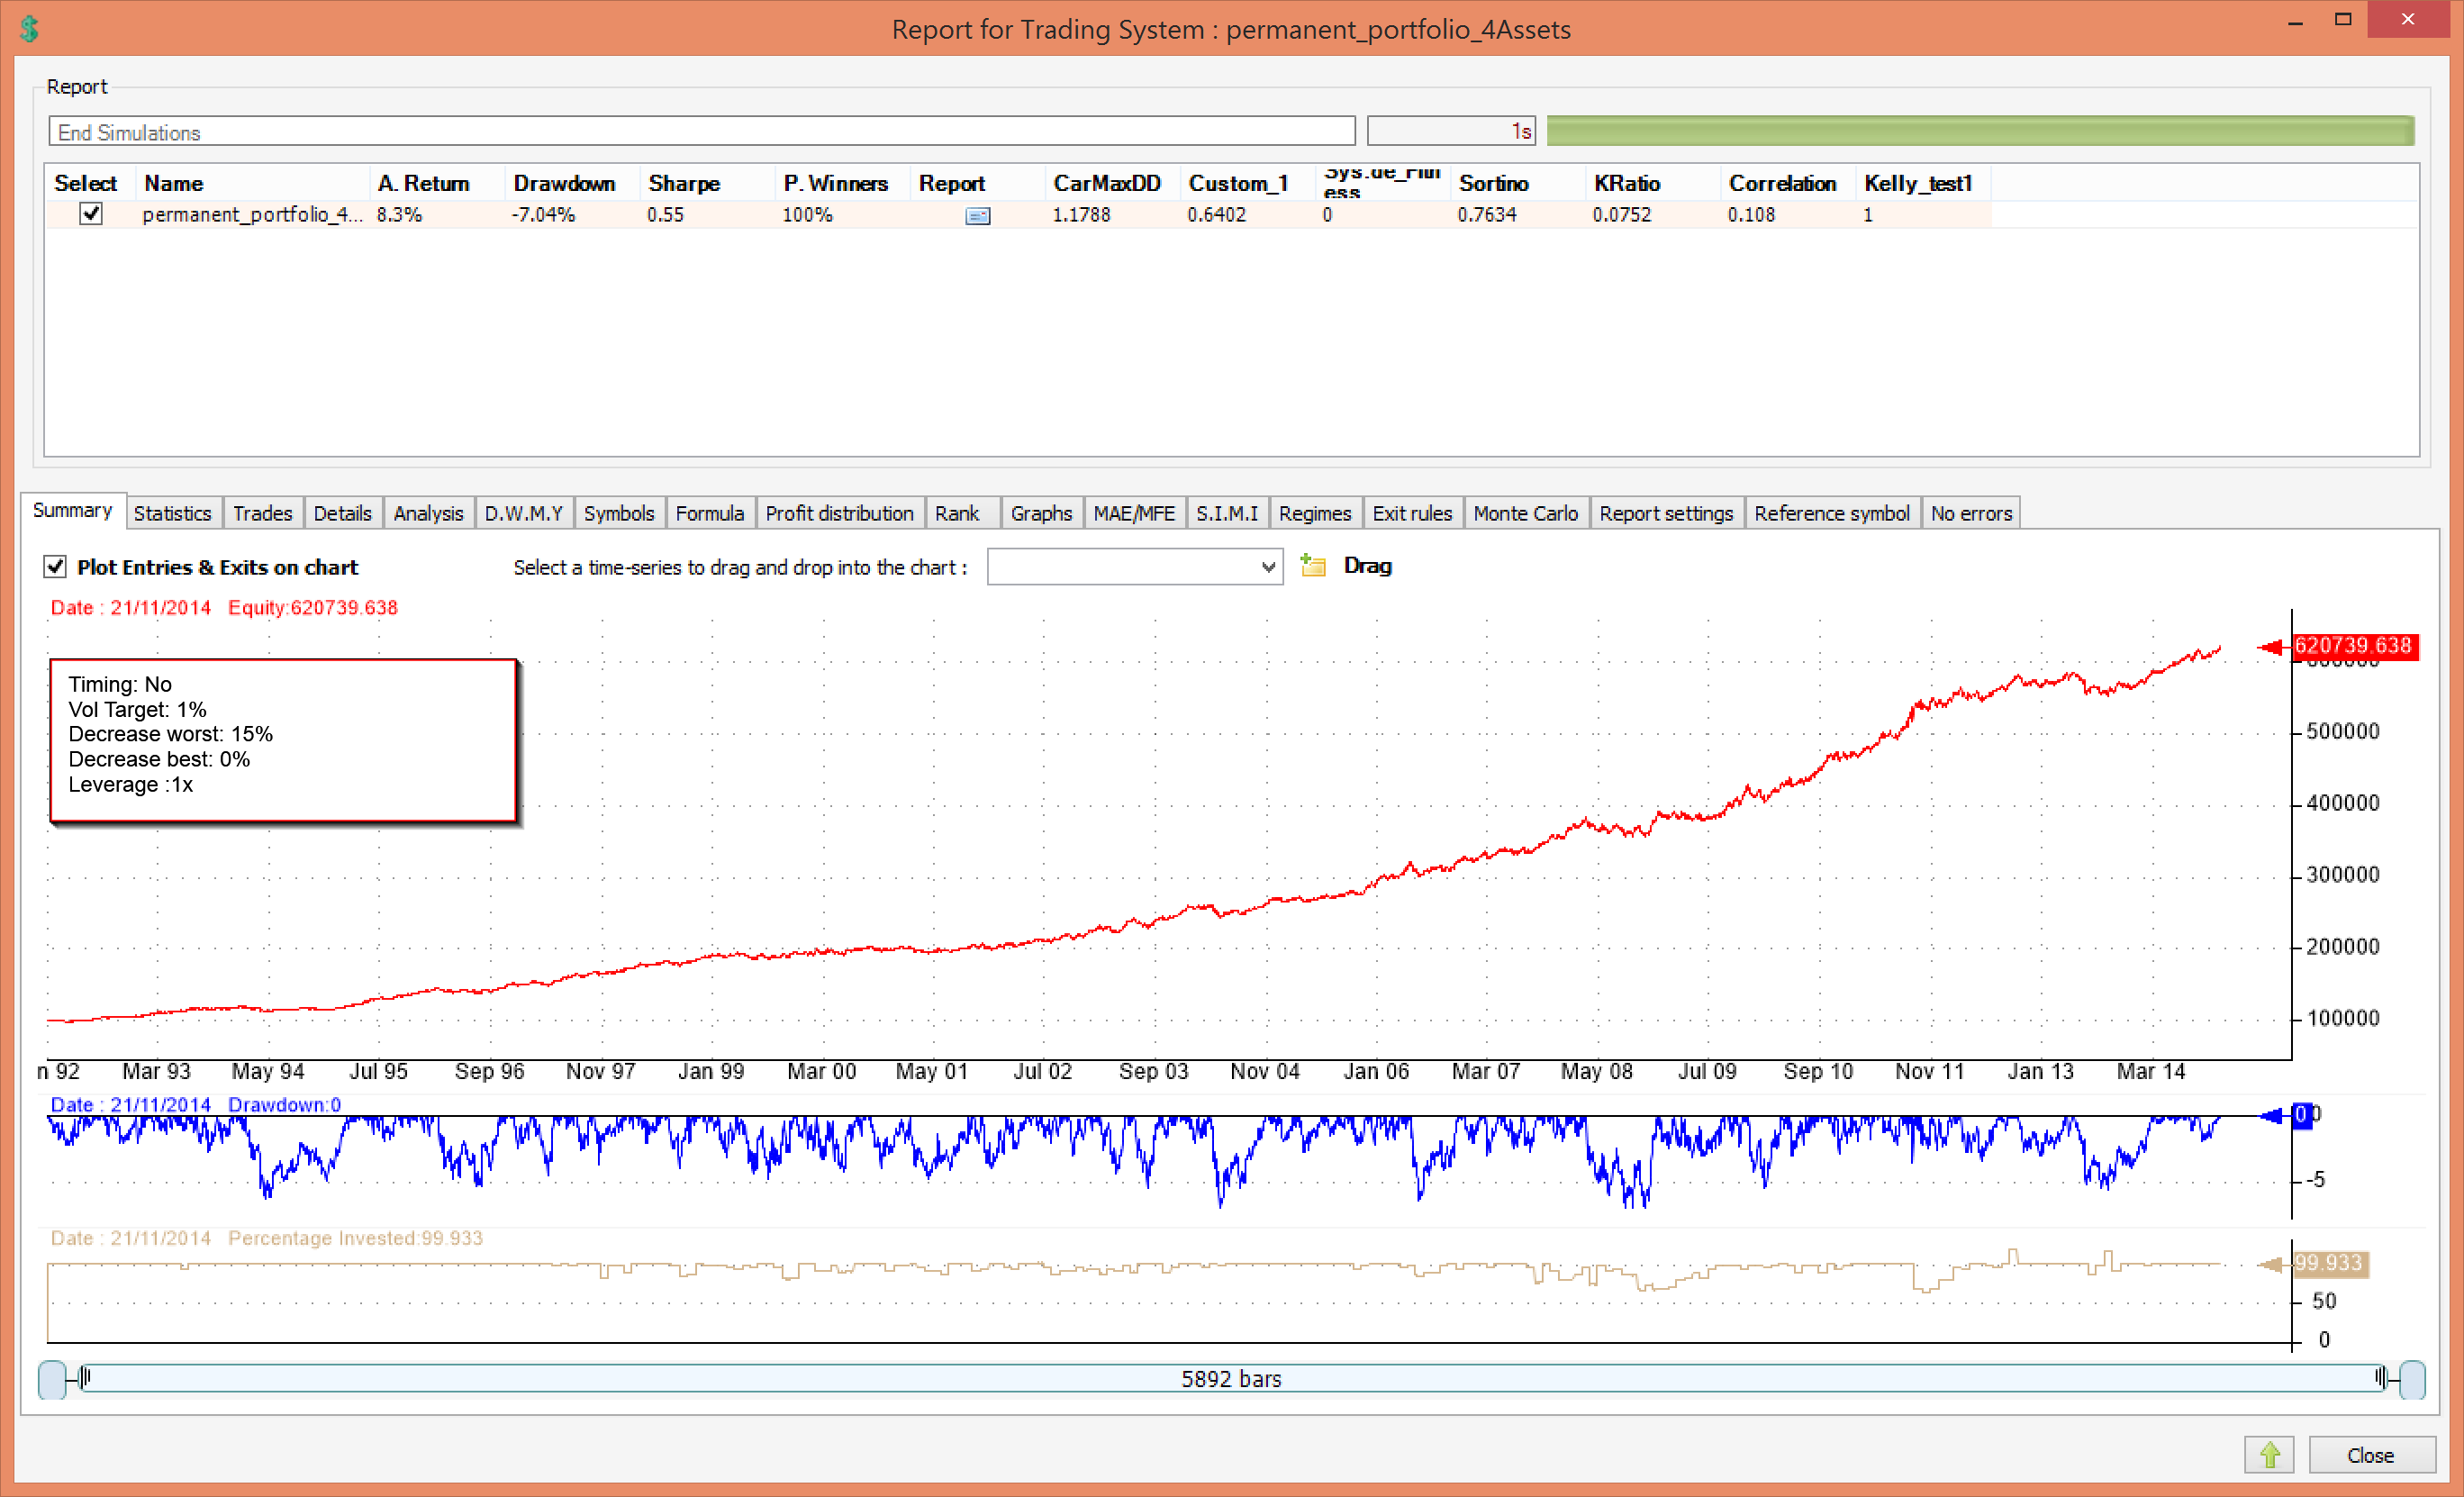
Annual return is up to 8.3% while draw-down comes in at a low and very respectable 7%.
3. Mean Reversion
We will sell shares of the best short-term performer and distribute the money amongst the other assets.
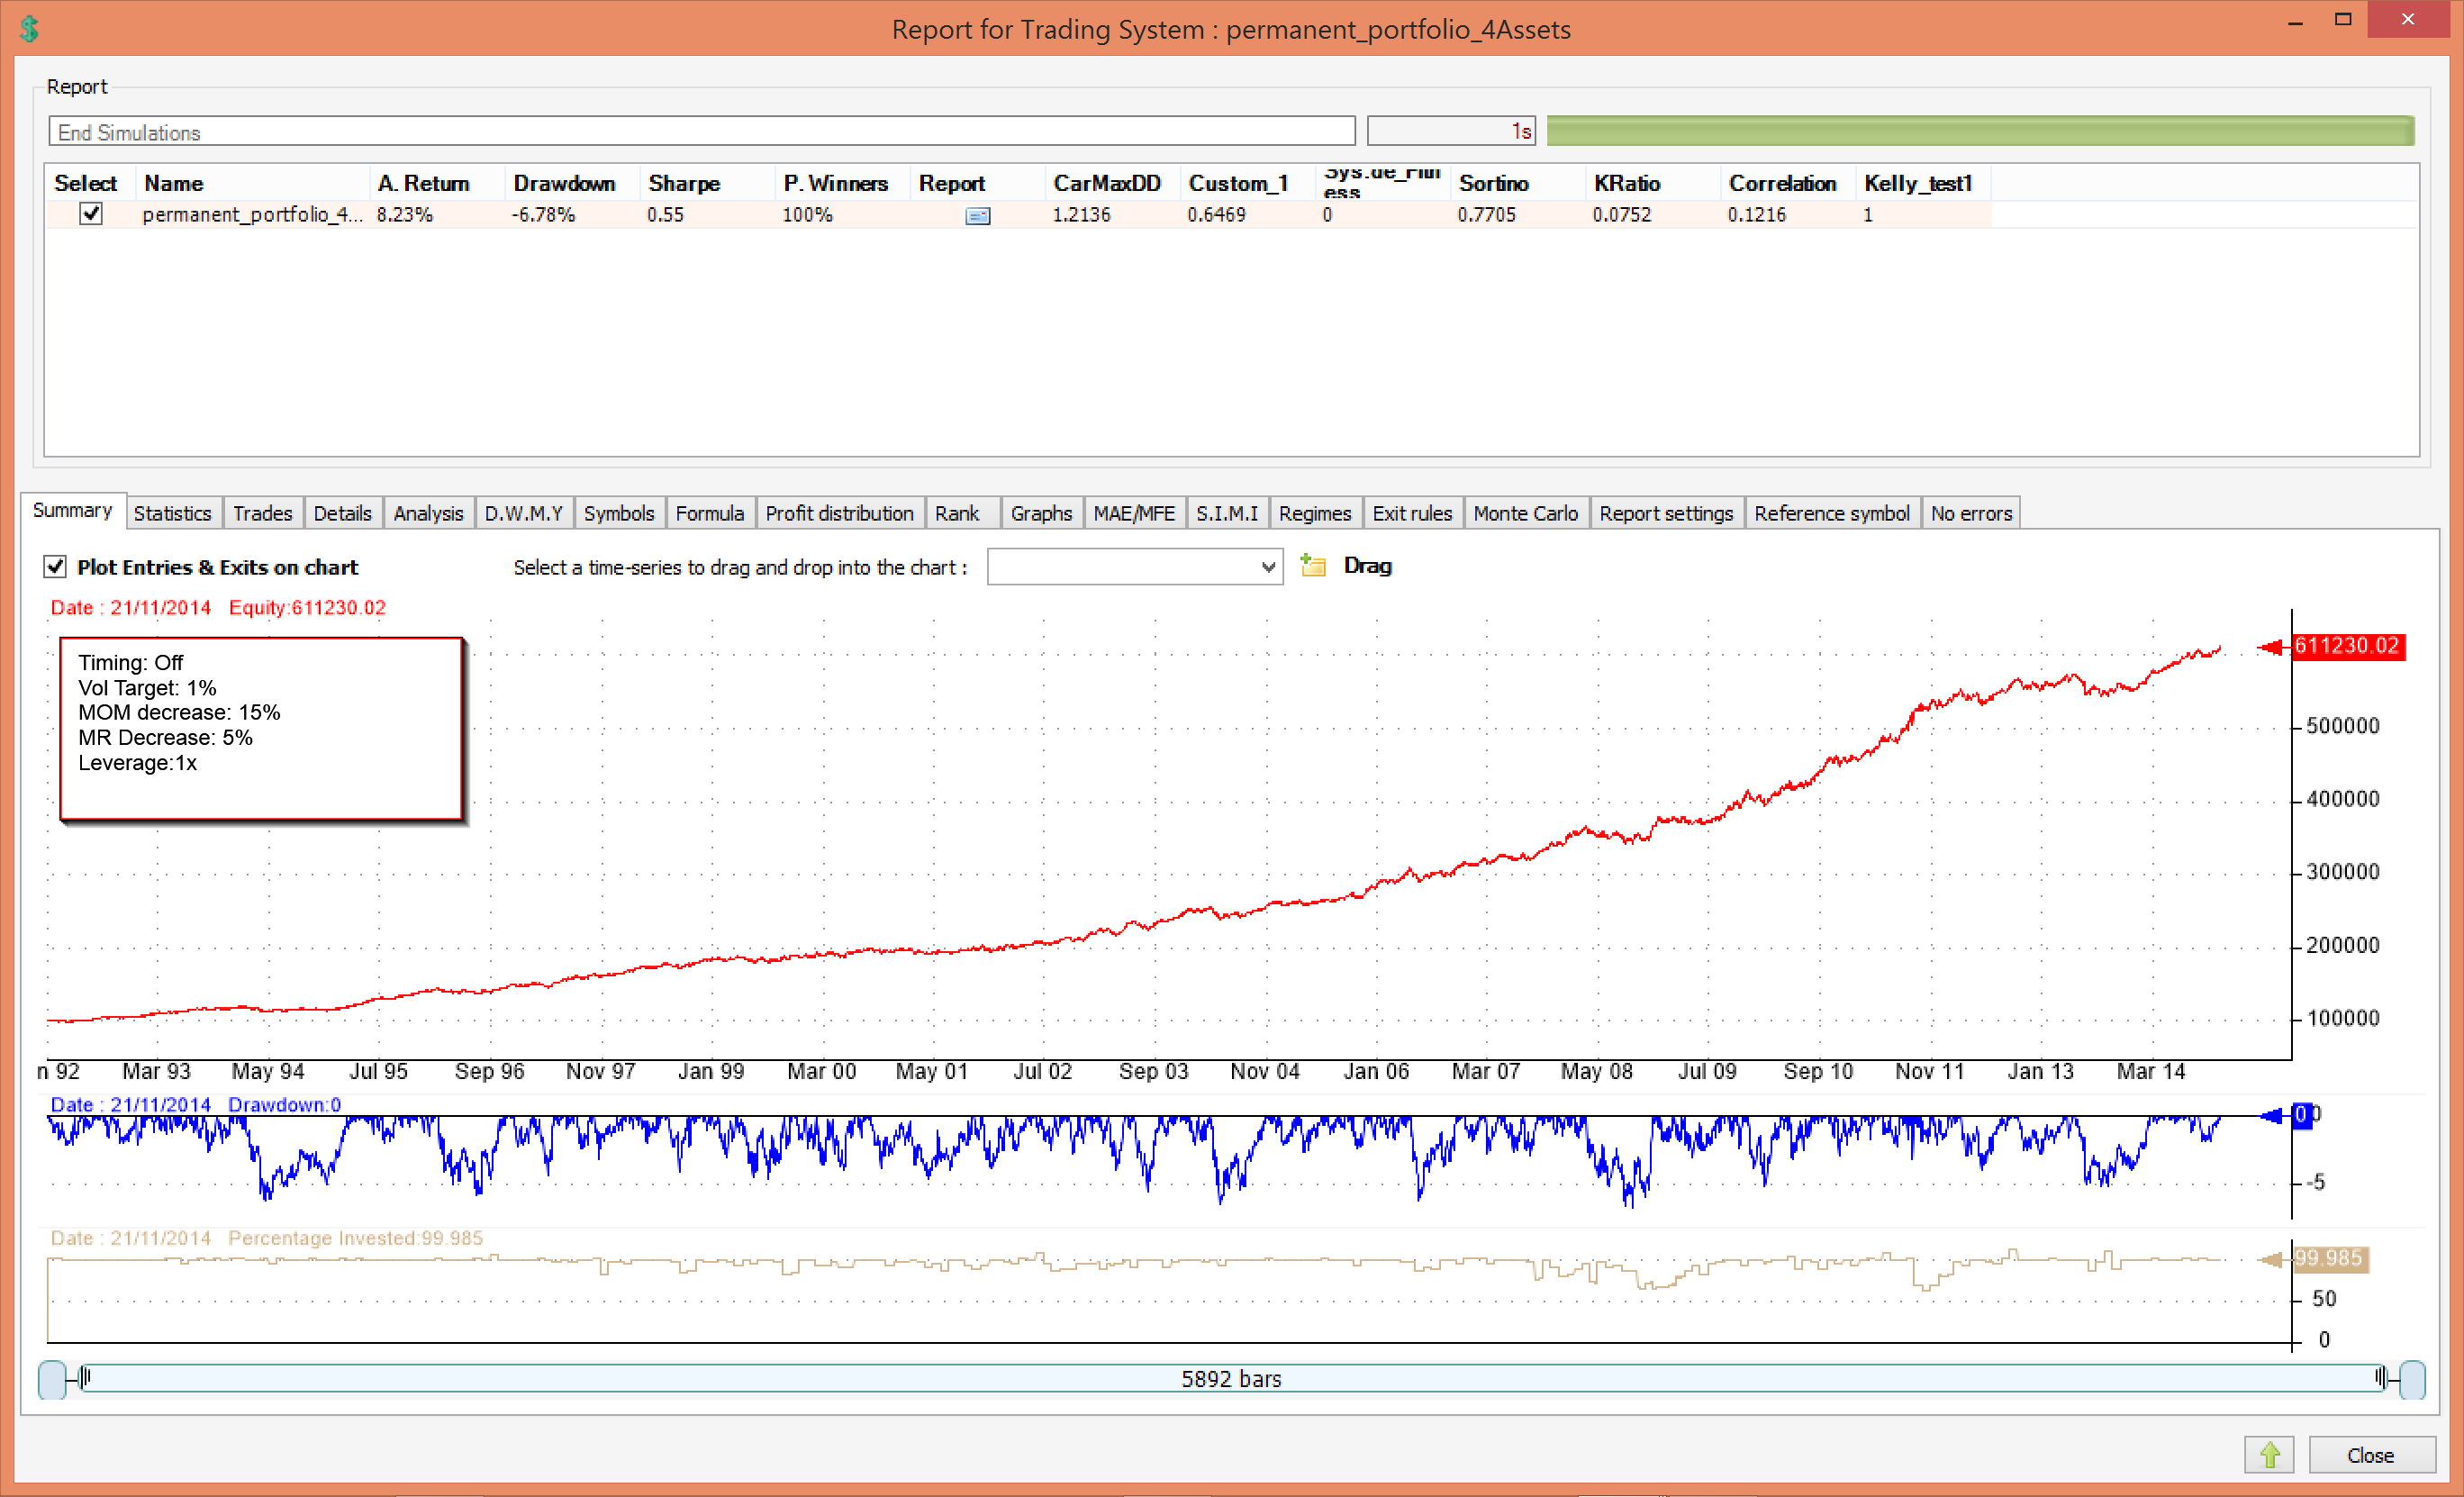
This marginally improves risk adjusted returns by further limiting draw-down to 6.78% while keeping annual returns almost the same.
4. Timing
Let’s use the good old simple average rule. If an asset’s price is below its own 200-day simple moving average then we sell it. If it crosses up then we buy it. Trade only on the beginning of the month.
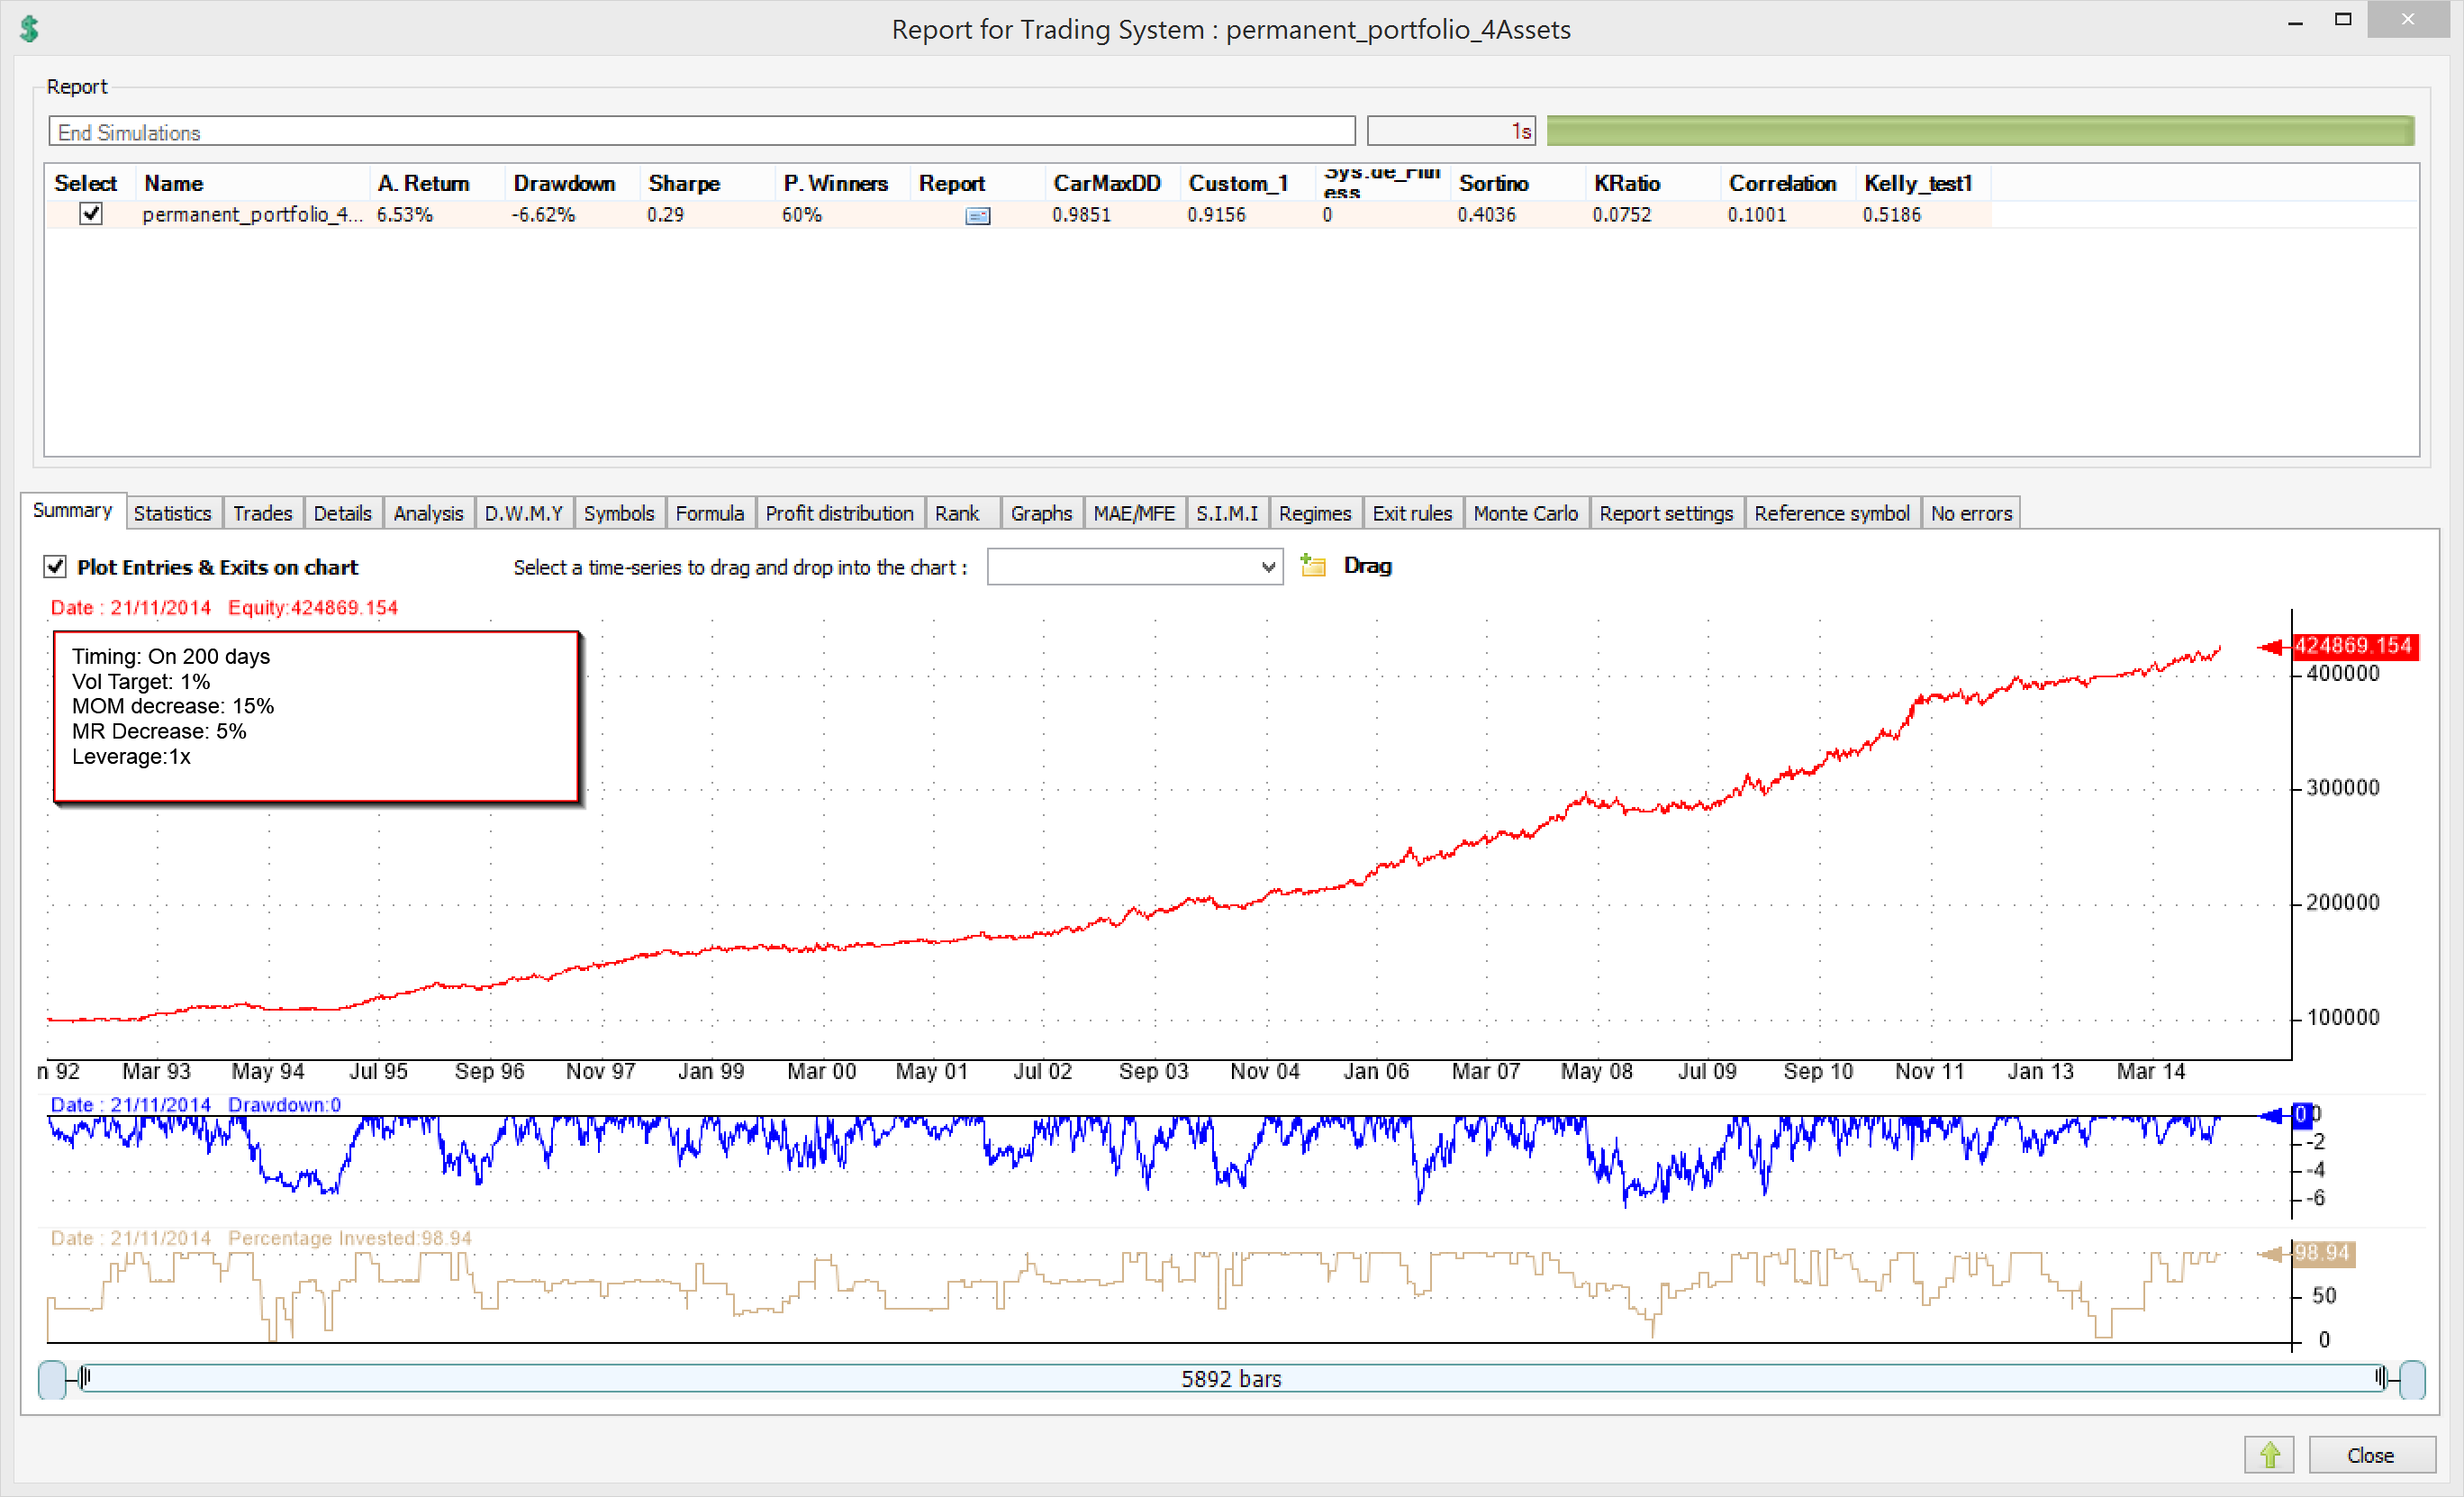
The drawdown comes in at a very low 6.62% with an average compound return of 6.57%.
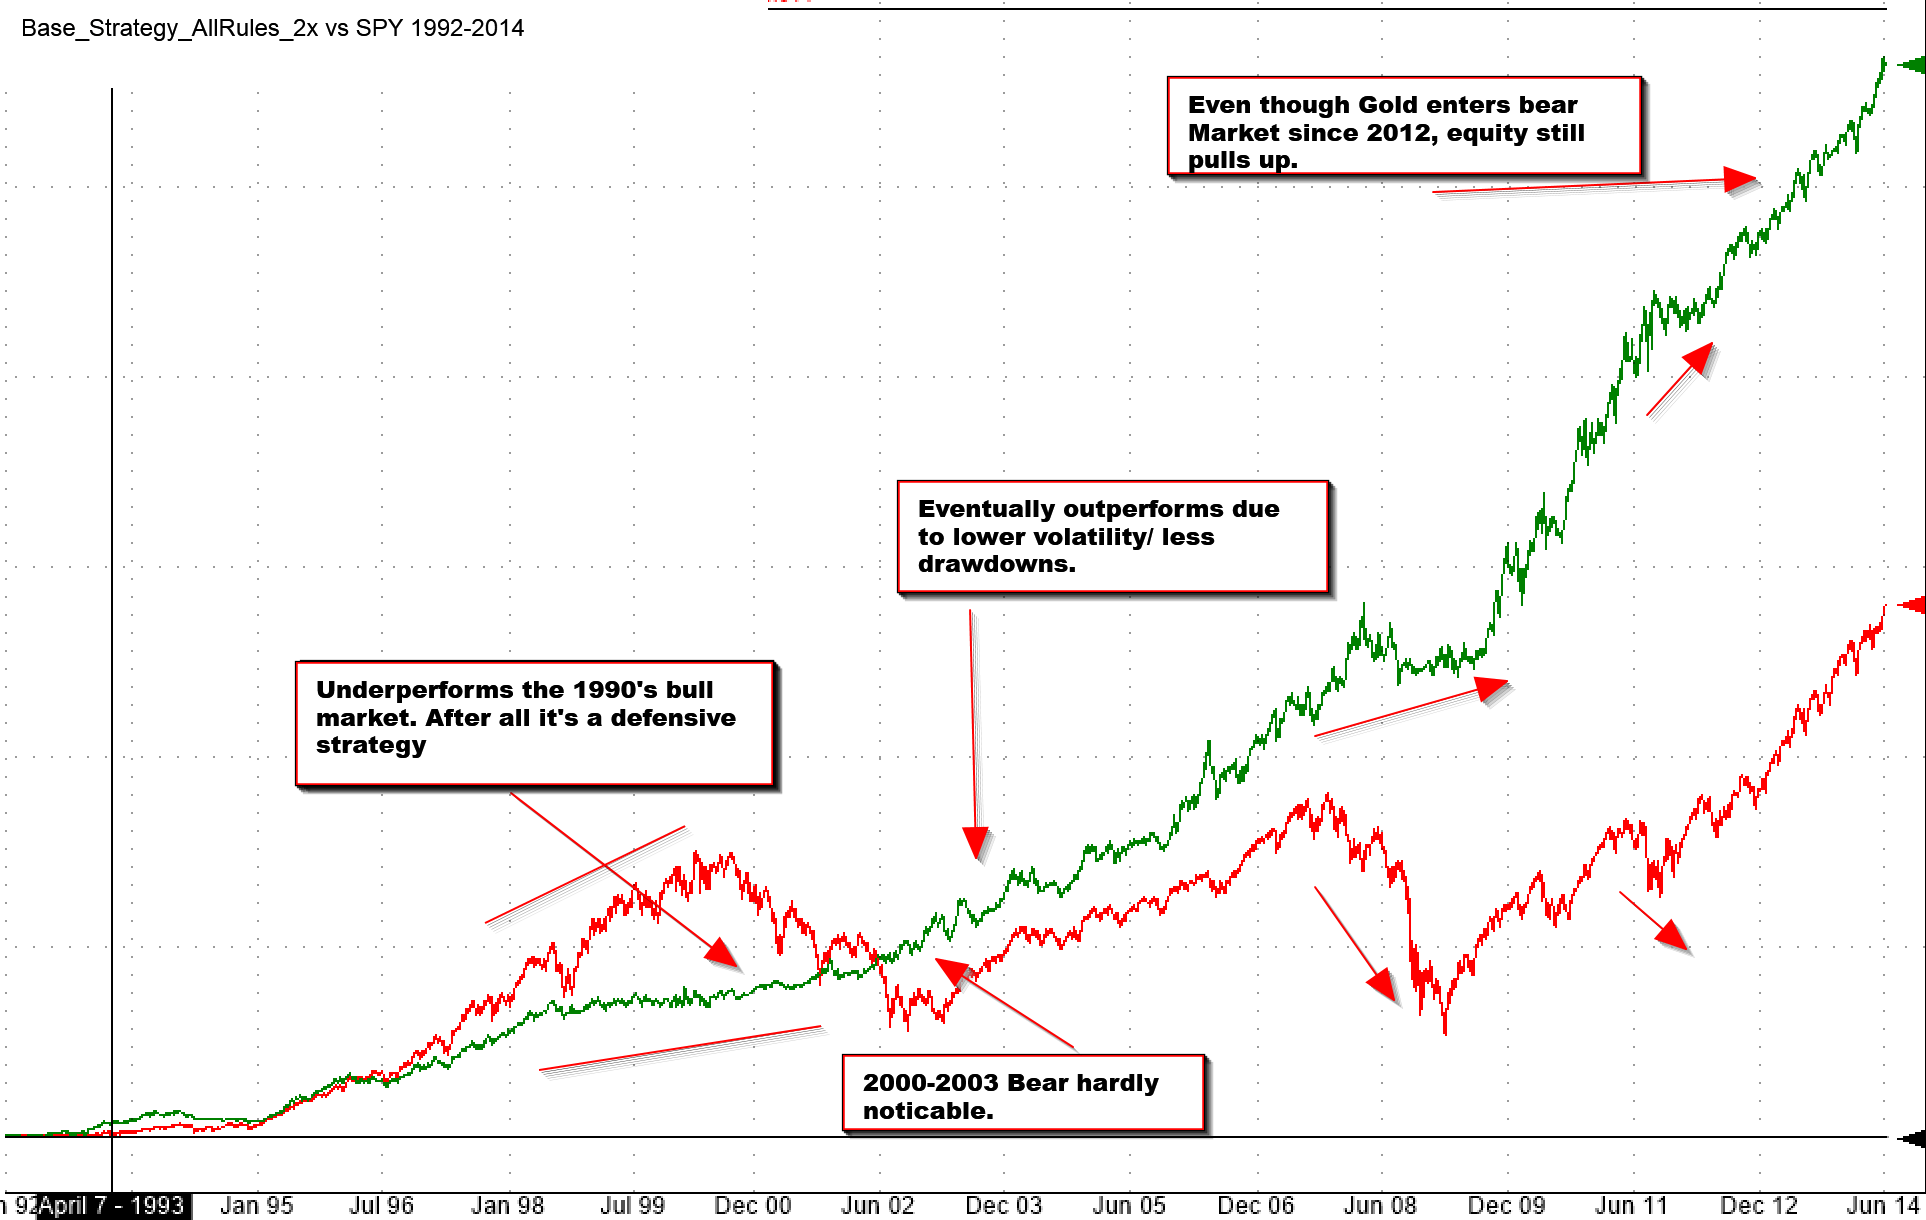
Due to the 200-day rule and the volatility filter, the portfolio will further reject or shrink positions and be only partly invested in risk assets. This provides safety but does not allow good use of all available funds in the account. An investor looking for a better return can choose to increase all positions by a factor of 2. That means that the portfolio can be invested from 0% all the way to 200%.
This results in an average ‘percent invested’ number of around 130%. Now, keep in mind that one of the assets of the portfolio is short-term treasuries. If we chose to stay in “real” cash then we would run a portfolio that is on average invested around 100%. The idea here to be less exposed in volatile markets while participate fully once markets exhibit more stable trends.
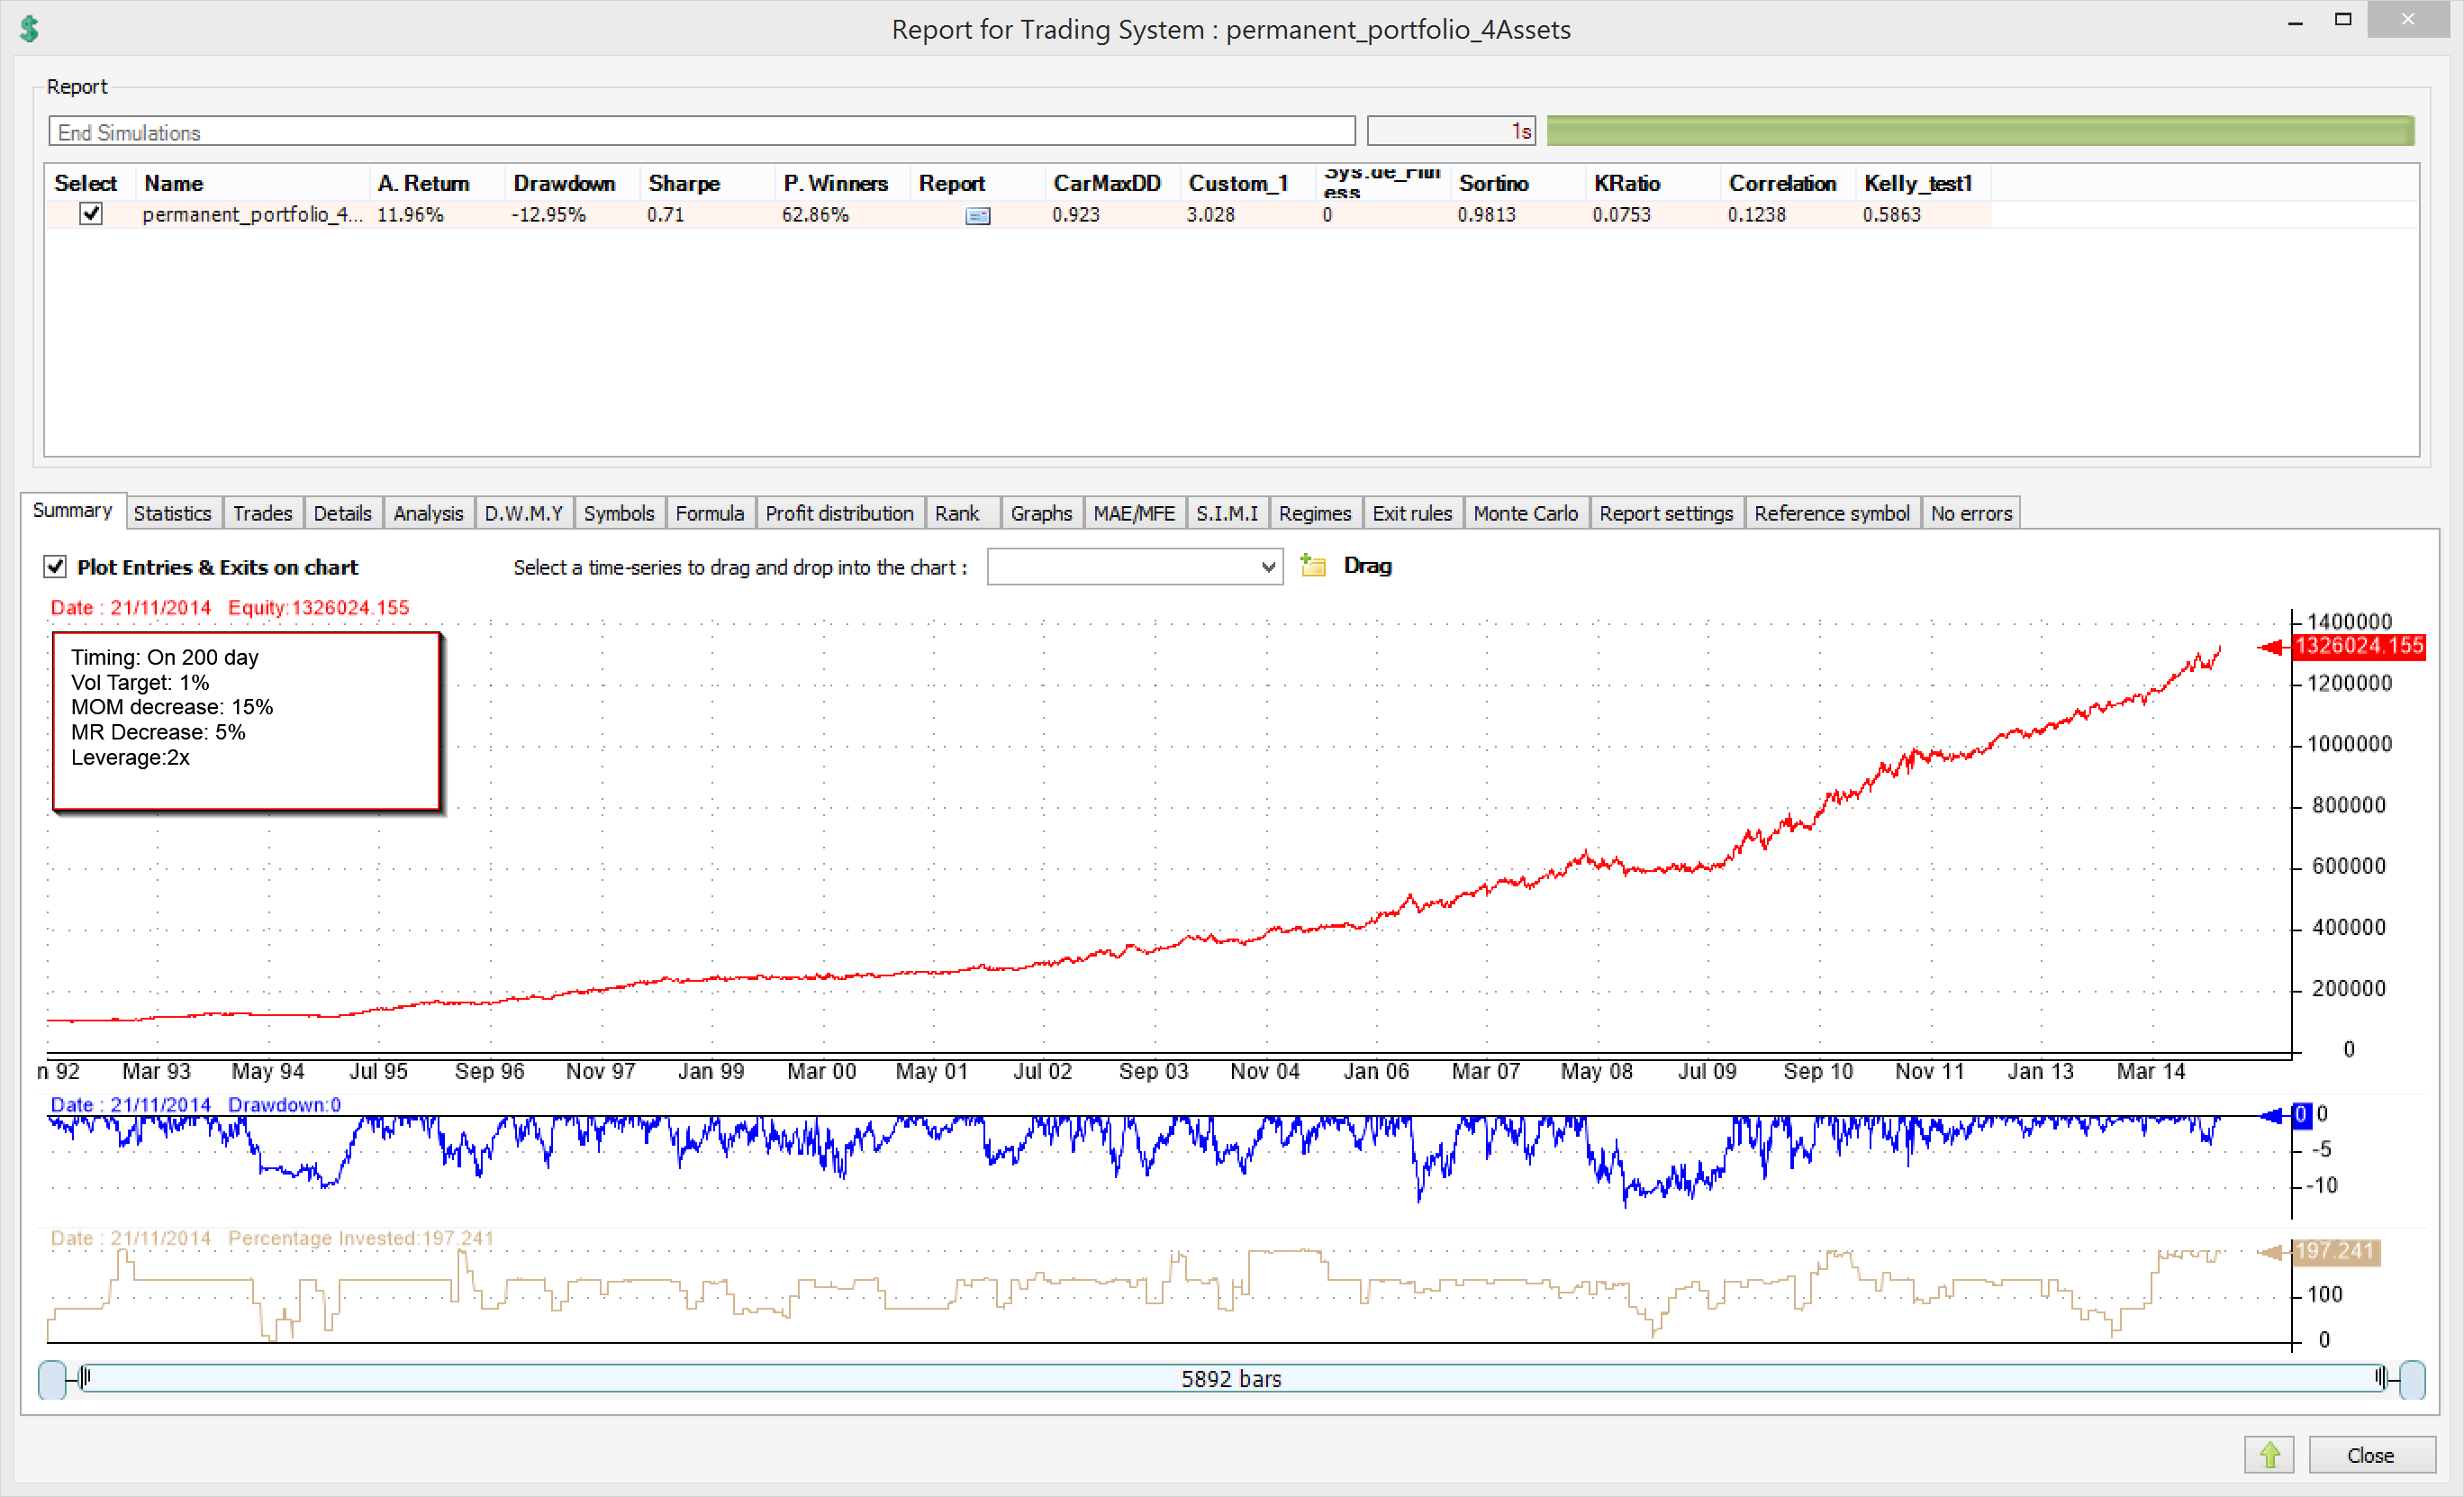
Using this kind of 2x leverage raises annual returns to 12% while keeping maximum drawdown below 13%.
What about over-fitting parameters. Let’s run a permutation of all parameters (10,401). We will assume no leverage (1x).
The mean for the CarMaxDD is 0.772381 with a standard deviation of 0.216059.
Modifying the Asset base and using ETFs.
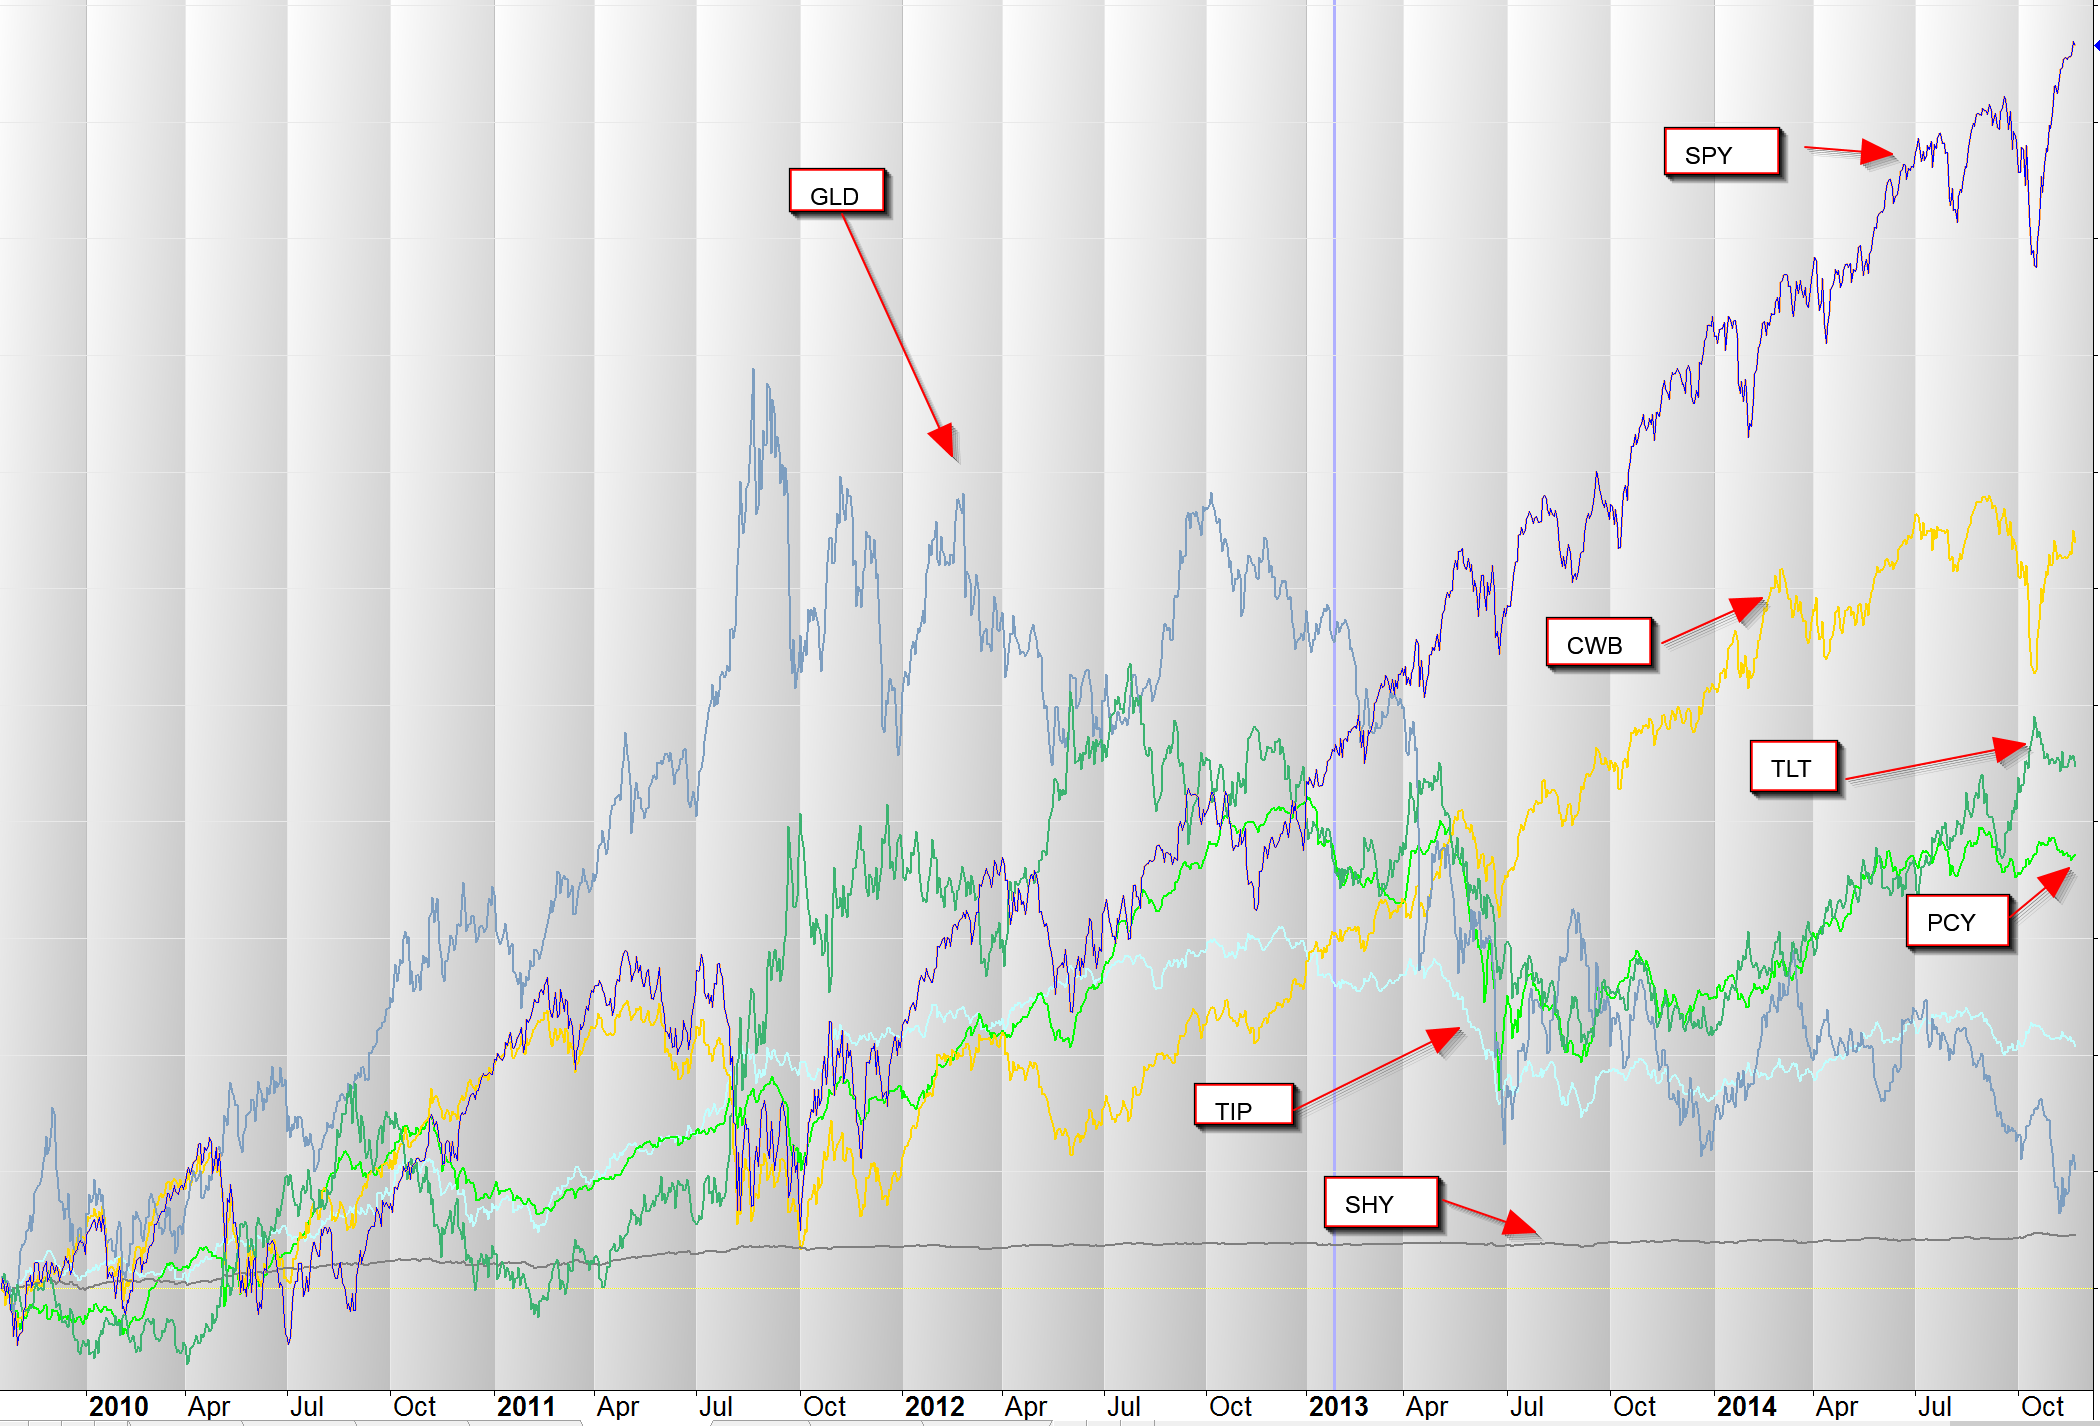
Finally let’s include some ‘newer’ asset classes that were not easily accessible during the 80’s.
- Convertible bonds (NYSEARCA:CWB)
- Foreign bonds (NYSEARCA:PCY)
- Inflation protected Treasuries (NYSEARCA:TIP)
First of all, you may notice that all three assets are less volatile assets, at least compared to the equity/commodities class.
Convertible Bonds lie somewhere between Bonds and Equities. They do carry a lower interest rate risk than straight bonds but also carry some equity-like risk.
Foreign Bonds is a diversifier out of U.S. debt.
Inflation protection Treasuries also carry some inflation (albeit, limited) protection from interest rate hikes.
So let’s go ahead and backtest using these 7 ETFs. We will use all layers mentioned before, as well as 2x leverage.

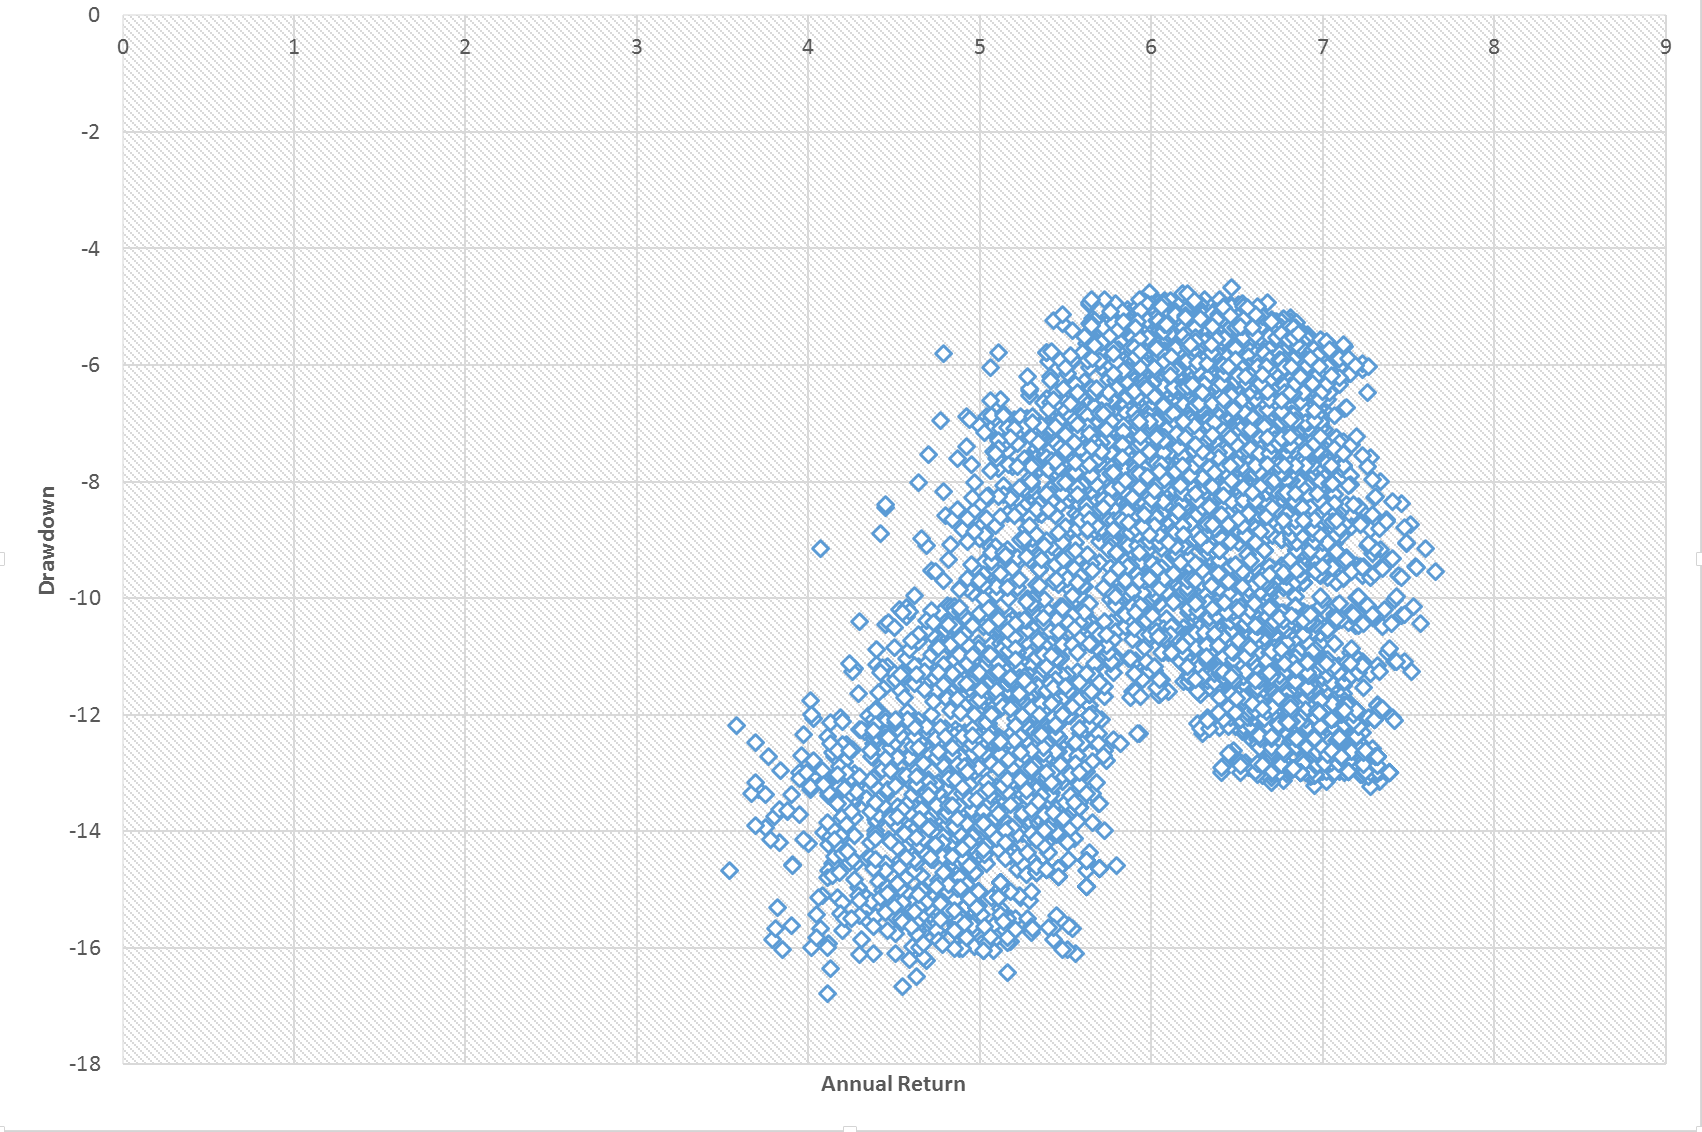
Since there is a good chance of over-optimizing parameters we will go through a number of parameters to get a sense of robustness:
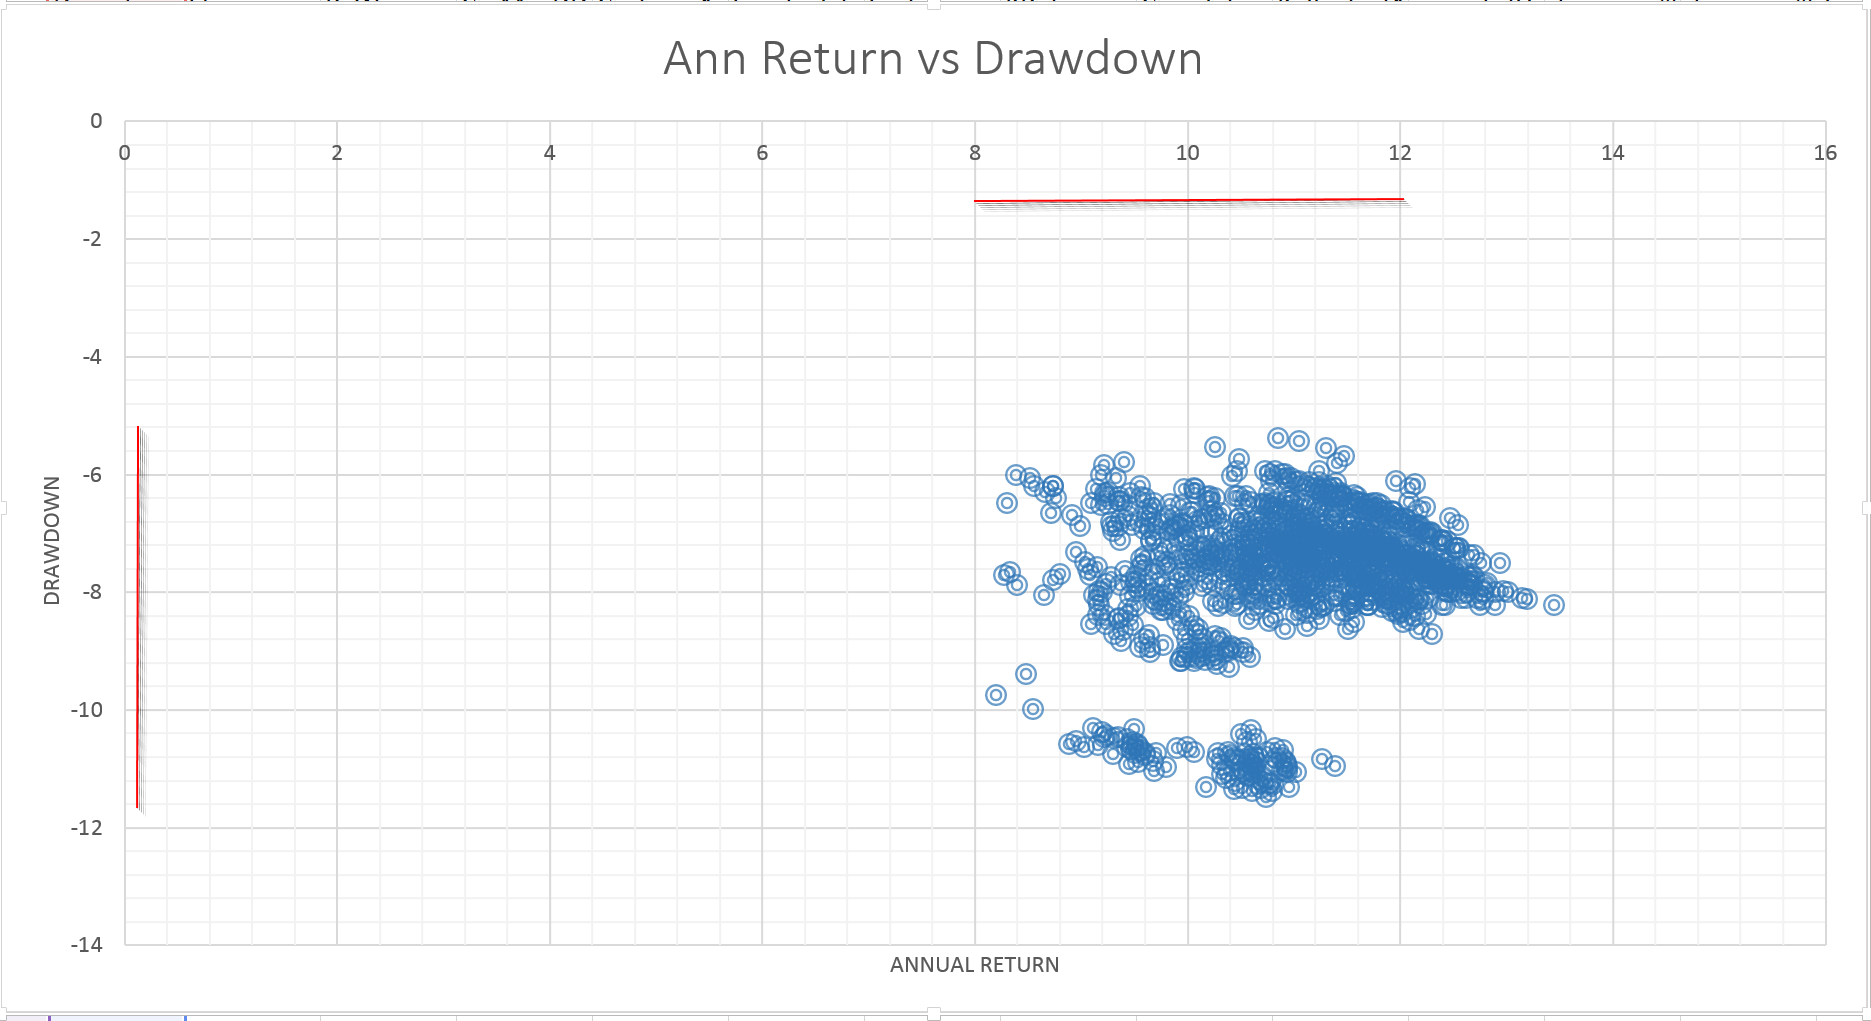
First, let’s look at annual return and drawdowns. Each dot is one combination of parameters. What we are interested in is the range of results.
Maximum drawdown is less than 12% while compound annual return comes in above 8%. Keep in mind that this system is designed for moderate growth with low volatility and risk. It is not meant to provide astonishing returns.
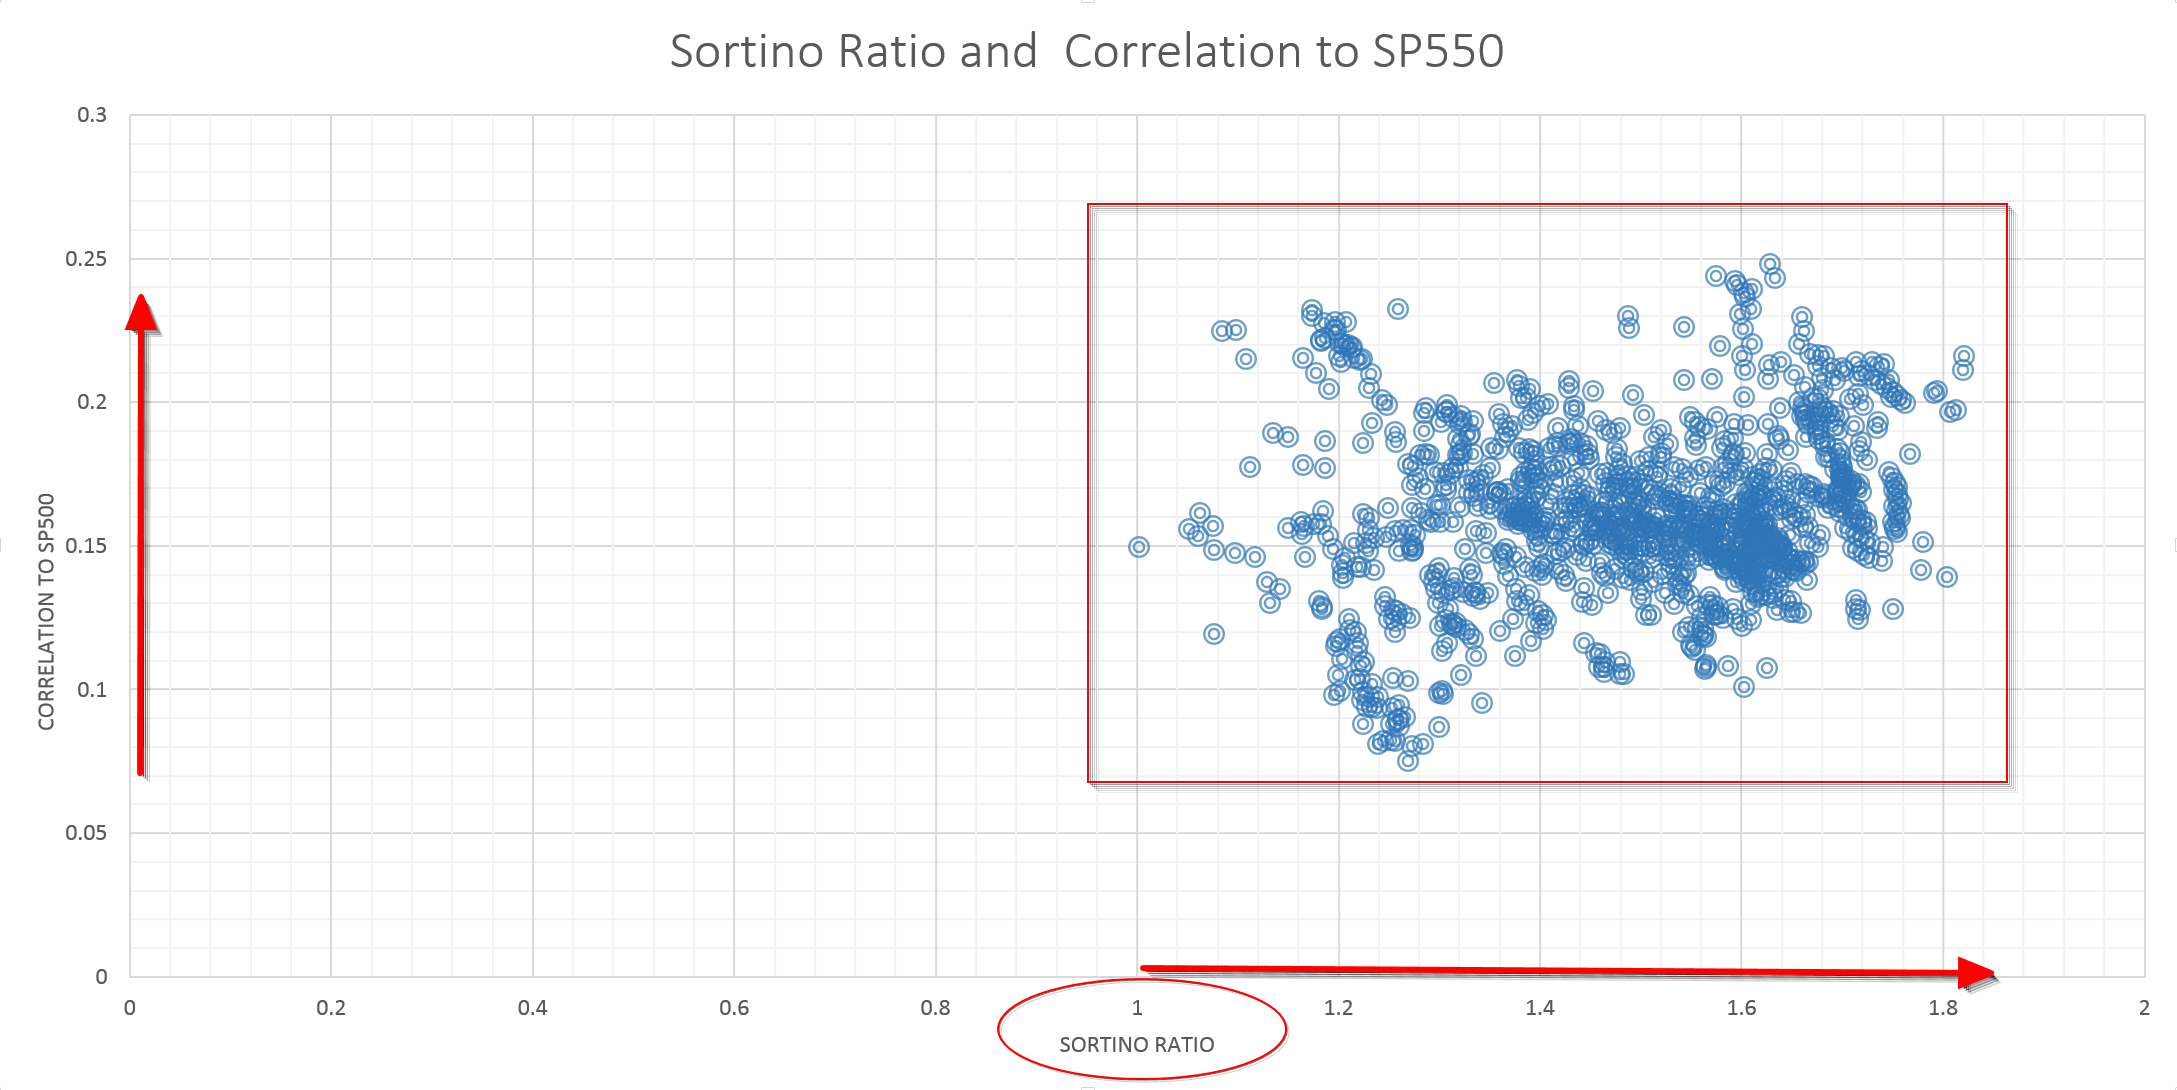
One more graph: Sortino Ratio and correlation to the S&P 500 index. Again we are looking for ballpark ranges.
Let me remind the reader that the Sortino Ratio is a risk adjusted metric similar to the Sharpe ratio but only takes into account downside volatility. The correlation to the S&P 500 is important to many investors that already have active investments in equity. If the strategy is too correlated to the S&P 500 then it often does not fit into larger portfolios and could be replaced by the index.
The Sortino Ratio comes in above 1 while correlation to the S&P 500 index comes in between 0.005 and 0.25.
Trading
This strategy trades monthly. There is plenty of ETFs to choose from. Stock index proxy ETFs include SPY, IVV, VOO as well as VTI and SCHB. For treasuries one can use TLT. Gold can be traded using GLD or IAU. And one of many options for cash is using SHY.
Conclusion:
It’s always interesting to look to the past for ideas on strategy development. In building a core, capital preservation strategy one can go back to such strategies as Harry Browne’s Permanent and Bridgewater’s All-Weather Portfolio. The main feature of these portfolios is a price-agnostic view of the markets and basic protection by using simple asset and weight selection.
In addition, in their most basic form, they have proven themselves in true, decade long, out-of-sample testing.
So once the essence of the strategies are incorporated, there is no reason not to include more recent rebalancing practices that have been introduced by academia as well as quant research: Momentum, mean reversion, volatility targeting and the more controversial timing rules.
| Strategy | CAGR | MAXDD | Sharpe | Since |
| PP B&H | 7% | 18% | 0.58 | 1992 |
| Bug 4 | 12% | 13% | 0.71 | 1992 |
| Bug 7 | 12% | 6.7% | 1.41 | 2007 |
The base case system uses only the 4 core assets and variable leverage. The system has a compound annual return of 12% with a 13% drawdown since 1992. Most importantly it has behaved well in recent market corrections.
Moving Forward – Expanded Assets
On top of these ‘layers’ we introduce three more assets that provide a slightly larger opportunity for diversification and a slight bias towards increasing rates. The corresponding ETFs are CWB, TIP and PCY.
Since 2007 the expanded strategy gave an annual return of 12% with a maximum drawdown of 6.74%.
Running through a parameter’s test we still come up with Sortino ratios between 1 and 1.8 and drawdowns below 12%.
Robustness
Is the 200-day simple moving average chosen “after-the-fact”?
Well, because of the multiple ‘layering’, results seem robust in terms of picking look-back periods. In other words, momentum and timing are, in some ways, similar in their effect. If an asset underperforms, it will go underweight using the momentum rule until it crosses its own average and be sold. So shifting through parameters in timing or momentum will have less effect than if they stood as single rules.
As for selection bias, keep in mind that the main 4 assets have been tested ‘out-of-sample for some 20 years. The additional three assets, TIPS, Convertible Bonds and Foreign bonds are lower volatility assets that could provide an additional edge in the current environment and should not add excessive risk to the strategy.
Backtesting Bias
Backtesting a strategy does not mean that backtested returns guarantee future returns.
It does mean that one has thought about the strategy and detailed it enough as to create rules that keep an investor disciplined and protect him from his own emotions and the daily market noise.
Hi Sanz,
As usual, another insightful post.
I do have a number of questions and a critique on this one…
> What is the look back period for mean reversion and relative strength adjustments?
> And for the volatility threshold, what was the target (chart shows 1%) and what was the indicator (ATR? smoothed realized volatility? VIX?)
> The return/MDD was a lot better before putting in the 200 day moving average. I wonder why you kept it in… did it improve the robustness analysis?
> And for the critique: the comparison of returns between bug versions are not for the same start/finish. The new instruments is starting in 2006 period while the others start much earlier.
Thanks,
Carl
Hello Carl,
Since the BUG strategy is available for subscription at Logical-Invest.com, I would rather post approximate numbers rather than exact ones.
a. Mean reversion runs with a short lookback period, less than 3 months. Momentum is calculated by averaging multiple short, medium and longer term momentum calculations.
b. The indicator used is averaged standard deviation of returns. The threshold is around 1.
c. Yes, you guessed right, the 200 day MA was placed for robustness even though it does hurts backtest performance.
d. Very true.Out of sample results below: It would be nice to compare with the "old" 4-asset PP version. Keep in mind that bonds and gold have under-performed.
http://logical-invest.com/portfolio-items/the-bug-leveraged/
Time to add commodities? If from a Macro view you think inflation is coming.