
No, it’s not french and it’s not the movie.
It’s a fast-N-rough “Adaptive Multi strategy Multi Instrument” model.
Let’s assume we want to trade mean-reversion: If price moves down we buy, if it moves up we sell.
Possible Indicators from the blog-o-sphere:
RSI(2),RSI(3),RSI(4)
DV2 here and here
BSI here or here
BoilingerBands
CRSI here
TD9 here
Question 1: Which Indicator to use?
One way to choose an indicator is to run backtests for each one (and each one’s parameters) and pick the one that has performed the best in the recent past. “Performance” can be pure profit or it can be any other metric we choose: CAR/MDD (annual return/MaxDrawdown), Profit Factor, Expectancy or your very own “Bliss function“.
So if DV2 has performed best in the past 6 months, maybe we should use that to trade for the next few weeks.
Question 2: What should we trade?
Just one instrument?
Why not backtest all indicators on all instrument and let the data tell us which instrument behaves best with which indicator? We can then trade that one. Did someone say “overfit”?.
Why not a bunch of instruments? A portfolio! Yes and we ‘ll throw some weights in there, too:
30% SPY 10% AAPL 10% XLU 20% IBM 30% GLD … wightN*InstrumentN
I guess now we have to backtest the different indicators with these different weights on our instruments, too. What are we doing here? Let’s step back.
Question 3: What are we doing here?
We start with a set of selected assets (StockA, StockB,… StockN).
We bring in a set of selected indicators (ind1, Ind2, …IndN).
We then build an “ammi” that picks and chooses from these two universes.
We optimize that “ammi” using some type of non-exhaustive optimization technique.
In other words we are creating a portfolio and trading each instrument inside the portfolio with each own indicator/strategy. So what’s the catch? There’s nothing new here. We could just trade SPY with DV2 and AAPL with RSI(3). Allocate 30% of capital to strategy “SPY” and 10% to strategy “AAPL”. Is there an advantage in mixing it all up?
For the purposes of this post we will assume:
1. Our optimizing target is % profit.
2. We are investing a fixed percentage of current equity on each trade (i.e., 10% of Equity). In other words we are compounding.
By optimizing one instrument and one strategy, the optimizer will look for the most consistent “timing” to enter and exit trades.
By optimizing the whole AMMI, the optimizer is handed one more tool. Since it wants to maximize compound profit it can do so by minimizing max drawdown which in turn gets accomplished by minimizing correlations between the “weighted and traded” equity curves. So, in theory, the optimizer should not necessarily choose the best timing of each instrument/indicator but rather the best combination of instruments/strategies that are somewhat profitable and least correlated*. We hope that this criterion is more robust criterion than just timing.
Almost forgot! We also want to be able to change both the “instrument” and the “strategy” as time passes. That means we re-optimize every x days and trade with the fresh settings. Hence, the “Adaptive Multi strategy Multi Instrument” , a.k.a, AMMI, nick-name.
For the sake of simplicity, we will consider indicators RSI(2), RSI(3) and RSI(4). Possible thresholds are 0–>50 for a Buy signal and 50–>100 for a Sell signal. We will use 10 instruments that can have weights ranging from 5% –> 100%. We assume the standard 2x leverage can be used.
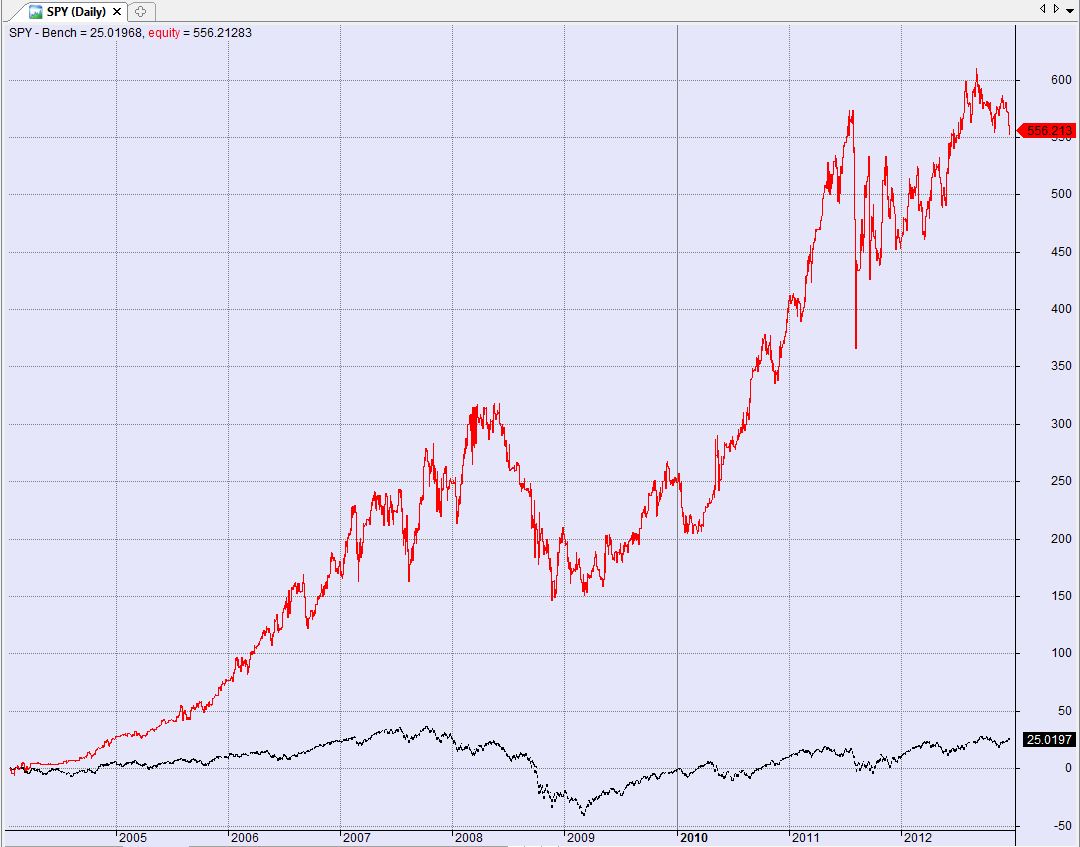
Let’s run an Out Of Sample test. In_Sample (IS) Optimization period is 2 years, Out_Of_Sample trading period (OOS) is 3 months.**
Optimization is done using Amibroker’s non-exhaustive CMAE plug-in set to run very few “runs” so as not to overfit (and not wait too long…). Target for the optimization is pure % Profit (hence the huge draw-downs).
Here’s the result trading a few instruments and using RSI(2), RSI(3) and RSI(4) as possible indicators with varied thresholds. This is an OOS (out of sample, i.e., realistic) equity. At 40%+ (in the “good” version) draw-downs, it’s not something I would trade***. It’s just for illustration purposes.
Again. this is a rough “model”. It is best used as a starting point to get ideas going. It might also help to get a sense of how different data groups react to different indicators. Instead of mean reverting indicators you could have trend following , or pattern based indicators. And instead of optimizing precise values you could fuzzify them.
———————————————————————————
* Adding a losing strategy to a profitable strategy may increased the Sharpe Ratio of the system.
———————————————————————————
The code in Amibroker:
//----Code by Sanz P.-----------------------------------------------------//
//----Place the instruments on a watchlist and select it under Parameters
//----Optimize/Walk Forward on that watchlist
//------------------------------------------------------------------------//
function Set2D( tablename, x, y, value )
 {VarSet( tablename + StrFormat("%03.0f%03.0f", x, y ), value );}
 function Get2D( tablename, x, y )
 {return VarGet( tablename + StrFormat("%03.0f%03.0f", x, y ) );}
 OptimizerSetEngine("cmae");
 OptimizerSetOption("Runs", 3 );
 OptimizerSetOption("MaxEval", 300 );
 WatchlistNumber =Param("Choose Watchlist with Tickers",12,0,30,1);
 TickerList= CategoryGetSymbols( categoryWatchlist , WatchlistNumber ) ;
 tablename="a";
 //init
 for( n=0; (instrument=StrExtract( TickerList, n)) != ""; n++)
 set2d( tablename, n, 0, n );
 Buy=Sell=0;
 for( n=0; (instrument=StrExtract( TickerList, n)) != ""; n++)
 {
 set2d( tablename, n, 1 , Optimize("Ticker"+n+ "Position",20,0,50,5) ); //pos
 set2d( tablename, n, 2 , Optimize("Ind"+n,2,0,2,1) ); //ind
 set2d( tablename, n, 3 , Optimize("Thrsh"+n,20,0,100,5) ); //thr
 }
 for( n=0; (instrument=StrExtract( TickerList, n)) != ""; n++)
 {
      if (Name()== instrument)
      {
      indicator=0;//init
      indicatorcode=get2d( tablename, n, 2 );
           switch(indicatorcode)
           {
           case 0:
           indicator=RSI(2);
           break;
           case 1:
           indicator=RSI(3);
           break;
           case 2:
           indicator=RSI(4);
           break;
           }
           PositionSize= - get2d( tablename, n, 1 );
           thresh=get2d( tablename, n, 3 );
           Buy=Cross(thresh,indicator);
           Sell=Cross(indicator,thresh);
      }
 }
 SetTradeDelays(1,1,1,1);
 BuyPrice=SellPrice=ShortPrice=CoverPrice=O;
 SetOption("MaxOpenPositions",10);
Maybe it's just me but I get a "Could not add that many optimzation variables" error. I have to start task manager to close Ami. I have a small watchlist selected, six symbols. Any thoughts? Using Ami 5.40.
Regards,
John
John,
Did you get around to solving the problem? I have never seen that error in AB before.
worked for me. Nice code and as you said, good place to start. Good work here. I will try it with some position sizing methods and other indicators.
I finally got it to work. My problem was I manually changed the watchlist number in the Param code but didn’t change the watchlist number in the AA parameters. When I changed that the optimization worked. First time this issue arose. Lesson learned.
Regards,
John
Here is a video on how to set watchlist etc. http://screencast.com/t/ocaOLAYKElNp
John, so you need to set watchlist number in editor as well as parameters to get it to optimize?
This line is the code to specify watchlist:
WatchlistNumber =Param("Choose Watchlist with Tickers",12,0,30,1);
I had to change the 30 to my watchlist # (61) but didn't have to when I shot the video.
Nice video! Thanks.
John