What happens, then once a strategy becomes public domain? Do they loose their edge?
All tests are performed on a set of 20 ETFs:
DIA,EEM,EFA,EWH,EWJ,EWT,EWZ,FXI,GLD,ILF,IWM,IYR,QQQQ,SPY,XHB,XLB,XLE,XLF,XLI,XLV
Tthe strategy can hold up to 10 ETFs at any time. Commissions at $0.005 a share.
Strategy 1: 3 Day High/Low
The rules:
1. ETF is above MA(200)
2. ETF is below MA(5)
3. ETF has made three consecutive lower lows
4. ETF has made three consecutive lower highs
BUY on the close of the day these criteria are met.
SELL on the close of the day the ETF closes above its MA(5).
The exact opposite for SHORT/COVER.
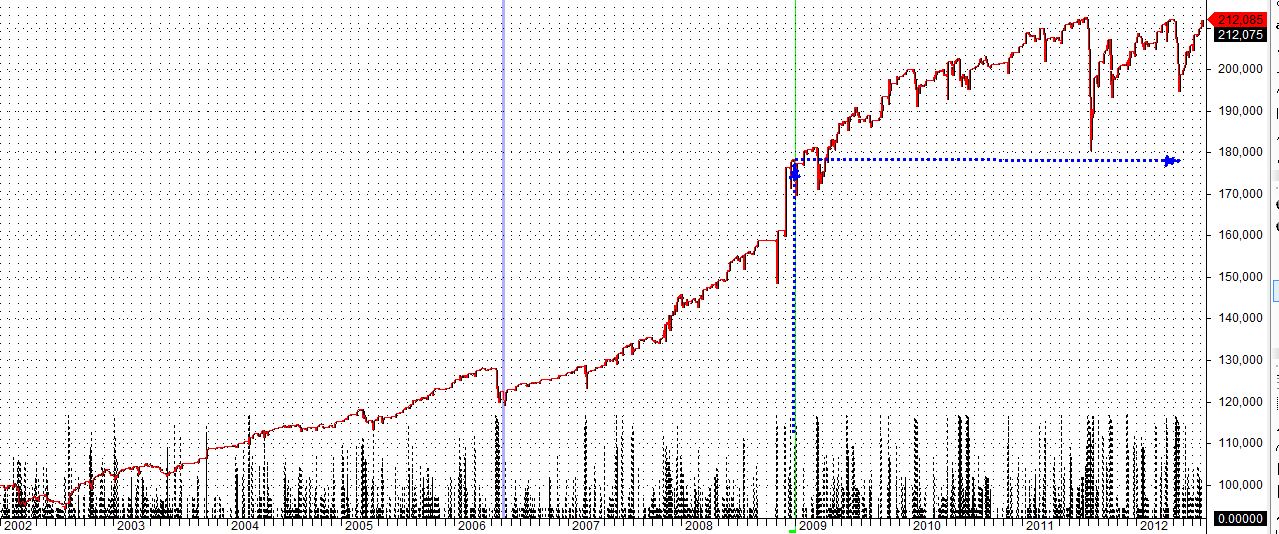
“In-Sample” 2002-2009: CAR/MDD=1.22 .
Profit = 77728.30 (77.73%), CAR = 8.56%, MaxSysDD = -10319.40 (-7.00%), CAR/MDD = 1.22,
# winners = 649 (75.20%), # losers = 214 (24.80%)
“Out-of-sample” 2009-2012: CAR/MDD=0.38
Profit = 22155.67 (22.16%), CAR = 5.74%, MaxSysDD = -18627.71 (-15.19%), CAR/MDD = 0.38,
# winners = 381 (71.48%), # losers = 152 (28.52%)
The strategy holds up fairly well even after 2009 but under-performs compared to it’s 2002-2009 smooth equity, especially after 2011.Keep in mind that 2009-2011 has been a good bull run for the market in general.
During the difficult 2011 it does not perform so well.
a. Simple version, 20 ETFs – Jan 1,2002 – Aug.1,2012
Detailed Stats:
| Statistics |
|---|
| All trades | Long trades | Short trades | |
|---|---|---|---|
| Initial capital | 100000.00 | 100000.00 | 100000.00 |
| Ending capital | 212084.70 | 153151.01 | 158933.69 |
| Net Profit | 112084.70 | 53151.01 | 58933.69 |
| Net Profit % | 112.08 % | 53.15 % | 58.93 % |
| Exposure % | 8.91 % | 5.44 % | 3.47 % |
| Net Risk Adjusted Return % | 1258.07 % | 977.38 % | 1697.80 % |
| Annual Return % | 7.36 % | 4.11 % | 4.47 % |
| Risk Adjusted Return % | 82.57 % | 75.51 % | 128.81 % |
|
|
|||
| All trades | 1389 | 886 (63.79 %) | 503 (36.21 %) |
| Avg. Profit/Loss | 80.69 | 59.99 | 117.16 |
| Avg. Profit/Loss % | 0.57 % | 0.48 % | 0.74 % |
| Avg. Bars Held | 4.56 | 4.40 | 4.84 |
|
|
|||
| Winners | 1025 (73.79 %) | 665 (47.88 %) | 360 (25.92 %) |
| Total Profit | 266745.82 | 145768.63 | 120977.19 |
| Avg. Profit | 260.24 | 219.20 | 336.05 |
| Avg. Profit % | 1.73 % | 1.50 % | 2.16 % |
| Avg. Bars Held | 3.44 | 3.36 | 3.58 |
| Max. Consecutive | 26 | 26 | 28 |
| Largest win | 3369.36 | 1449.04 | 3369.36 |
| # bars in largest win | 3 | 2 | 3 |
|
|
|||
| Losers | 364 (26.21 %) | 221 (15.91 %) | 143 (10.30 %) |
| Total Loss | -154661.12 | -92617.62 | -62043.50 |
| Avg. Loss | -424.89 | -419.08 | -433.87 |
| Avg. Loss % | -2.69 % | -2.60 % | -2.83 % |
| Avg. Bars Held | 7.71 | 7.50 | 8.03 |
| Max. Consecutive | 10 | 10 | 10 |
| Largest loss | -3070.01 | -3070.01 | -2365.74 |
| # bars in largest loss | 13 | 13 | 13 |
|
|
|||
| Max. trade drawdown | -3944.05 | -3944.05 | -2993.90 |
| Max. trade % drawdown | -18.94 % | -18.92 % | -18.94 % |
| Max. system drawdown | -32323.67 | -33724.74 | -13937.44 |
| Max. system % drawdown | -15.19 % | -18.97 % | -9.20 % |
| Recovery Factor | 3.47 | 1.58 | 4.23 |
| CAR/MaxDD | 0.48 | 0.22 | 0.49 |
| RAR/MaxDD | 5.43 | 3.98 | 14.01 |
| Profit Factor | 1.72 | 1.57 | 1.95 |
| Payoff Ratio | 0.61 | 0.52 | 0.77 |
| Standard Error | 10672.47 | 6650.99 | 8080.77 |
| Risk-Reward Ratio | 1.18 | 1.14 | 0.62 |
| Ulcer Index | 2.06 | 4.21 | 2.53 |
| Ulcer Performance Index | 0.95 | -0.31 | -0.37 |
| Sharpe Ratio of trades | 1.60 | 1.49 | 1.79 |
| K-Ratio | 0.0699 | 0.0677 | 0.0365 |
|
|
||||||||
|---|---|---|---|---|---|---|---|---|
| Statistics |
|---|
| All trades | Long trades | Short trades | |
|---|---|---|---|
| Initial capital | 100000.00 | 100000.00 | 100000.00 |
| Ending capital | 122155.67 | 104344.90 | 117810.77 |
| Net Profit | 22155.67 | 4344.90 | 17810.77 |
| Net Profit % | 22.16 % | 4.34 % | 17.81 % |
| Exposure % | 11.07 % | 6.02 % | 5.05 % |
| Net Risk Adjusted Return % | 200.07 % | 72.15 % | 352.54 % |
| Annual Return % | 5.74 % | 1.19 % | 4.68 % |
| Risk Adjusted Return % | 51.82 % | 19.81 % | 92.56 % |
|
|
|||
| All trades | 533 | 300 (56.29 %) | 233 (43.71 %) |
| Avg. Profit/Loss | 41.57 | 14.48 | 76.44 |
| Avg. Profit/Loss % | 0.41 % | 0.17 % | 0.73 % |
| Avg. Bars Held | 4.91 | 4.79 | 5.08 |
|
|
|||
| Winners | 381 (71.48 %) | 216 (40.53 %) | 165 (30.96 %) |
| Total Profit | 76958.35 | 38256.95 | 38701.39 |
| Avg. Profit | 201.99 | 177.12 | 234.55 |
| Avg. Profit % | 1.83 % | 1.58 % | 2.17 % |
| Avg. Bars Held | 3.62 | 3.47 | 3.82 |
| Max. Consecutive | 24 | 23 | 28 |
| Largest win | 948.27 | 835.21 | 948.27 |
| # bars in largest win | 3 | 2 | 3 |
|
|
|||
| Losers | 152 (28.52 %) | 84 (15.76 %) | 68 (12.76 %) |
| Total Loss | -54802.67 | -33912.05 | -20890.62 |
| Avg. Loss | -360.54 | -403.71 | -307.21 |
| Avg. Loss % | -3.15 % | -3.45 % | -2.77 % |
| Avg. Bars Held | 8.15 | 8.18 | 8.12 |
| Max. Consecutive | 10 | 10 | 10 |
| Largest loss | -1767.74 | -1767.74 | -1361.94 |
| # bars in largest loss | 13 | 13 | 13 |
|
|
|||
| Max. trade drawdown | -2277.55 | -2277.55 | -1726.40 |
| Max. trade % drawdown | -18.92 % | -18.92 % | -16.66 % |
| Max. system drawdown | -18627.71 | -19432.71 | -8024.43 |
| Max. system % drawdown | -15.19 % | -16.39 % | -7.07 % |
| Recovery Factor | 1.19 | 0.22 | 2.22 |
| CAR/MaxDD | 0.38 | 0.07 | 0.66 |
| RAR/MaxDD | 3.41 | 1.21 | 13.10 |
| Profit Factor | 1.40 | 1.13 | 1.85 |
| Payoff Ratio | 0.56 | 0.44 | 0.76 |
| Standard Error | 3221.90 | 5001.76 | 2781.37 |
| Risk-Reward Ratio | 1.33 | 0.35 | 0.91 |
| Ulcer Index | 2.70 | 5.92 | 2.31 |
| Ulcer Performance Index | 0.13 | -0.71 | -0.31 |
| Sharpe Ratio of trades | 1.05 | 0.41 | 1.75 |
| K-Ratio | 0.0459 | 0.0121 | 0.0314 |
//Code by VangelisM. (aka – sanzprophet )
//Part of Code taken by afl from Library – Paul’s “Connors TPS – ETFs.afl”
Plot( C, “Close”, ParamColor(“Color”, colorBlack ), styleNoTitle | ParamStyle(“Style”) | GetPriceStyle() );
SetBacktestMode( backtestRegularRaw );
aggresive=ParamToggle(“Agreesive?”,”NO|YES”,0);
Buy=Sell=Cover=Short=0;
SetTradeDelays(0,0,0,0);
BuyPrice=SellPrice=CoverPrice=ShortPrice=C;
qty=Param(“PositionScoretions”,1,1,50,1);
SetOption( “MaxOpenPositions”, qty );
if(!aggresive)
{
aboveMA=C>MA(C,200);
belowMA5=C<MA(C,5);
Low3= H<Ref(H,-1) AND Ref(H,-1)<Ref(H,-2) AND Ref(H,-2)<Ref(H,-3)
AND L<Ref(L,-1) AND Ref(L,-1)<Ref(L,-2) AND Ref(L,-2)<Ref(L,-3);
Buy1=aboveMA AND belowMA5 AND Low3;
Buy=Buy1;
Sell=!belowMA5;
Sell=ExRem(Sell,Buy);
High3= H>Ref(H,-1) AND Ref(H,-1)>Ref(H,-2) AND Ref(H,-2)>Ref(H,-3)
AND L>Ref(L,-1) AND Ref(L,-1)>Ref(L,-2) AND Ref(L,-2)>Ref(L,-3);
Short1=C<MA(C,200) AND !belowMA5 AND High3;
Short=Short1;
Cover=belowMA5;
PositionSize=-98/qty;
PositionScore=IIf(Buy,100-RSI(3),RSI(3));
}
if(aggresive)
{
aboveMA=C>MA(C,200);
belowMA5=C<MA(C,5);
Low3= H<Ref(H,-1) AND Ref(H,-1)<Ref(H,-2) AND Ref(H,-2)<Ref(H,-3)
AND L<Ref(L,-1) AND Ref(L,-1)<Ref(L,-2) AND Ref(L,-2)<Ref(L,-3);
Buy1=aboveMA AND belowMA5 AND Low3;
Sell=!belowMA5;
High3= H>Ref(H,-1) AND Ref(H,-1)>Ref(H,-2) AND Ref(H,-2)>Ref(H,-3)
AND L>Ref(L,-1) AND Ref(L,-1)>Ref(L,-2) AND Ref(L,-2)>Ref(L,-3);
Short1=C<MA(C,200) AND !belowMA5 AND High3;
Cover=belowMA5;
BarsSinceSell = BarsSince(Sell);
InFirstPos =Flip(Buy1,Sell);
FirstTrigger = ExRem(InFirstPos, Sell);
BarsSinceFirstTrigger = BarsSince(FirstTrigger);
FirstTriggerPrice = IIf(BarsSinceFirstTrigger < BarsSinceSell,Ref(C,-BarsSinceFirstTrigger), 0 );
SecondEntry = aboveMA AND C < FirstTriggerPrice AND InFirstPos AND Ref(InFirstPos,-1);
InSecondPos = Flip(SecondEntry, Sell);
SecondTrigger = ExRem(InSecondPos, Sell);
BarsSinceSecondTrigger = BarsSince(SecondTrigger);
SecondTriggerPrice = IIf(BarsSinceSecondTrigger < BarsSinceSell,
Ref(C,-BarsSinceSecondTrigger), 0);
BarsSinceCover = BarsSince(Cover);
FirstShortEntry = Short1; ;
InFirstShortPos = Flip(FirstShortEntry, Cover );
FirstShortTrigger = ExRem(InFirstShortPos, Cover );
BarsSinceFirstShortTrigger = BarsSince(FirstShortTrigger);
FirstShortTriggerPrice = IIf(BarsSinceFirstShortTrigger < BarsSinceCover ,Ref(C,-BarsSinceFirstShortTrigger), 0 );
//FirstTriggerPrice = IIf(BarsSinceFirstTrigger < BarsSinceSell,Ref(O,-BarsSinceFirstTrigger+1), 0 );
SecondShortEntry = !aboveMA AND C > FirstShortTriggerPrice AND InFirstShortPos AND Ref(InFirstShortPos,-1);
InSecondShortPos = Flip(SecondShortEntry, Cover );
SecondShortTrigger = ExRem(InSecondShortPos, Cover );
BarsSinceSecondShortTrigger = BarsSince(SecondShortTrigger);
SecondShortTriggerPrice = IIf(BarsSinceSecondShortTrigger < BarsSinceCover,
Ref(C,-BarsSinceSecondShortTrigger), 0);
PositionSize=-98/qty;
PositionScore=IIf(Buy OR SecondEntry ,100-RSI(3),RSI(3));
Buy=IIf(Buy1,1,IIf(SecondEntry AND Sum(Secondentry,BarsSinceSell)==1 ,sigScaleIn,0));
Short=IIf(Short1,1,IIf(SecondShortEntry AND Sum(SecondShortentry,BarsSinceCover)==1 ,sigScaleIn,0));
}
GfxSelectPen( colorBlack, 2 );
GfxSelectFont(“Times New Roman”, 12, 200, False );
GfxTextOut(“3 Day High/Low”,10,20);
shape = Buy * shapeUpArrow + Sell * shapeDownArrow;
PlotShapes( shape, IIf( Buy, colorGreen, colorYellow ), 0,C );
Leave a Reply