
Inspiration strategy: http://empiritrage.com/2013/01/21/correlation-based-allocation/
Quoted from Empiritrage.com:
“We propose a model that is designed to identify bull-market and bear-market regimes. We examine correlation between stocks and bonds as a signal. Our hypothesis is that negative correlation between long bonds and stocks represents a bear-market regime, and a positive, or non-existent correlation, reflects a bull market regime.The model calculates rolling 90-day correlation estimates between the S&P 500 and long-bonds. At each month end, the model computes the 60-day MA of the correlation against the 600-day MA of the correlation. If positive, the model invests in risk; if negative, the model invests in riskless.”
I will do a different kind of implementation so my results will differ due to different data and different strategy. When referring to correlation I will be referring to the correlation of the SP500 to the inverse of the 10-year Treasury yield.
I will be using yahoo free data: ^GSPC (S&P500 Index) data as the “risk” asset and (1/ ^TNX, the reverse of the 10-year Treasury Yield) to represent long-bonds.
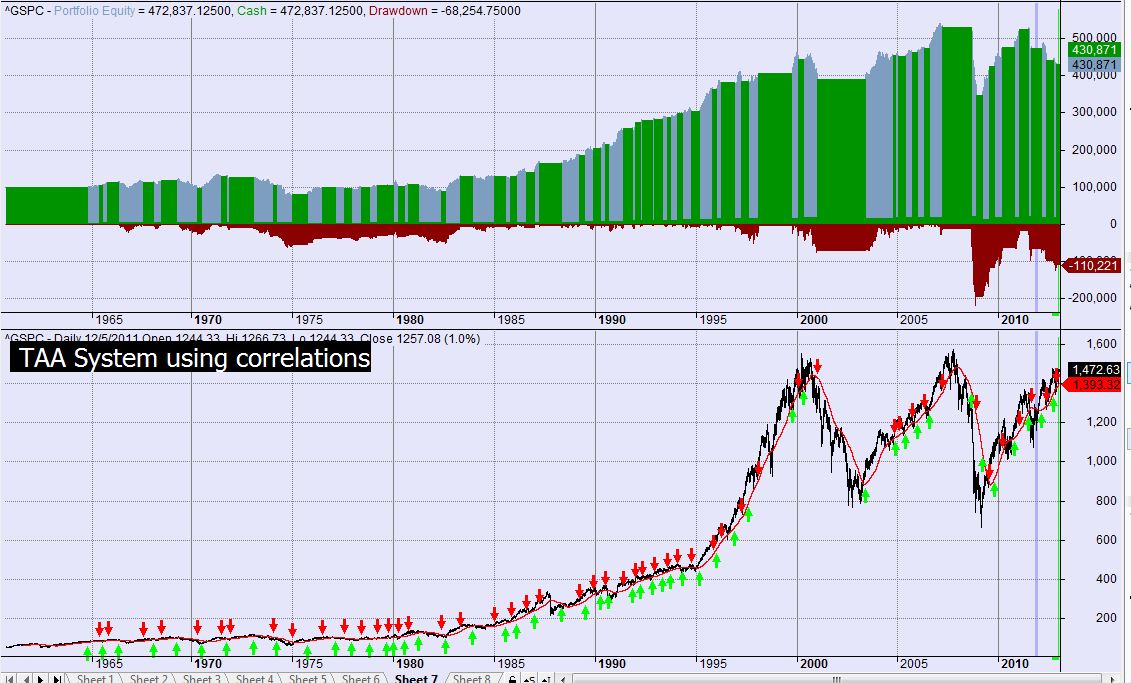
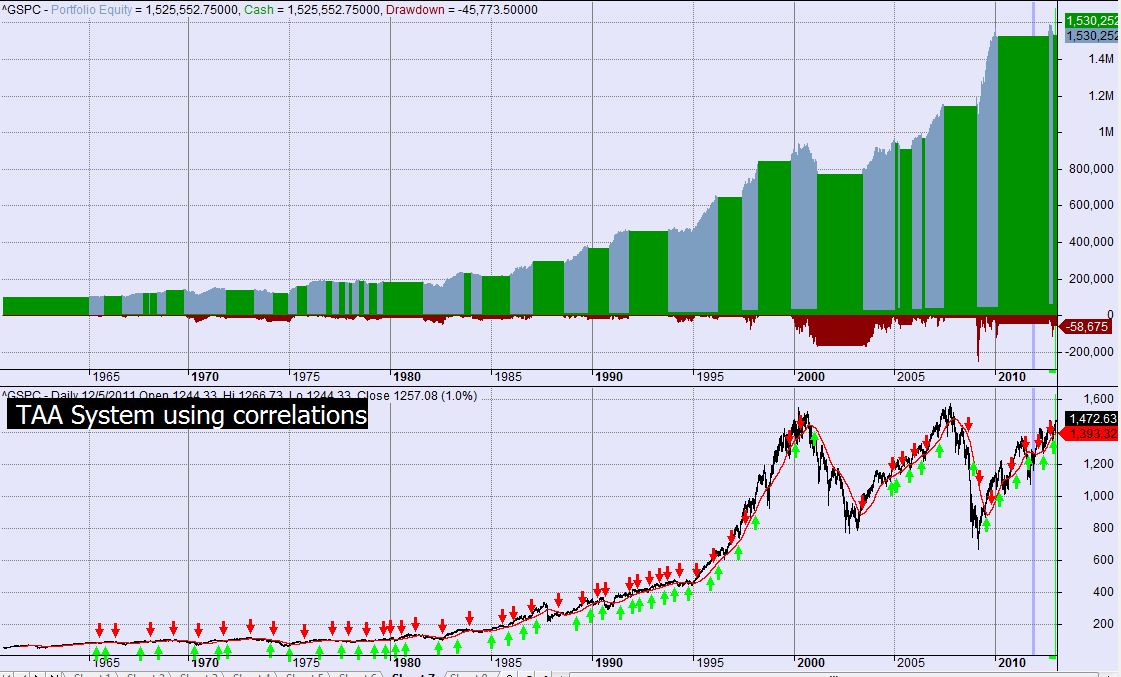
The above graph is using params [90,60]
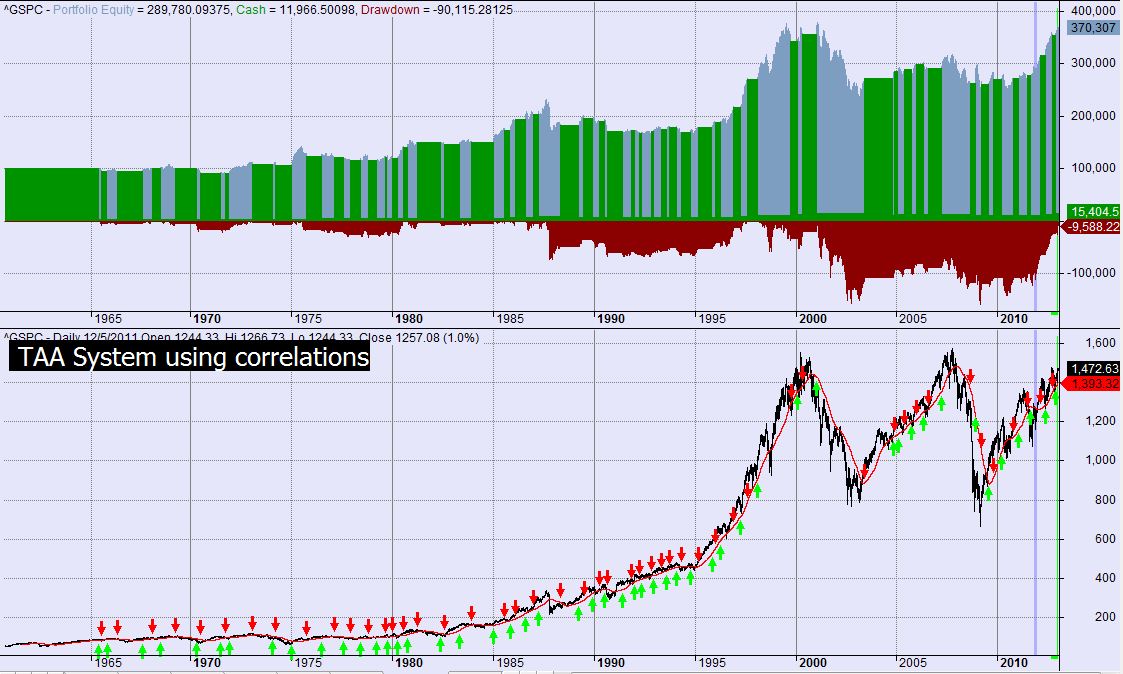
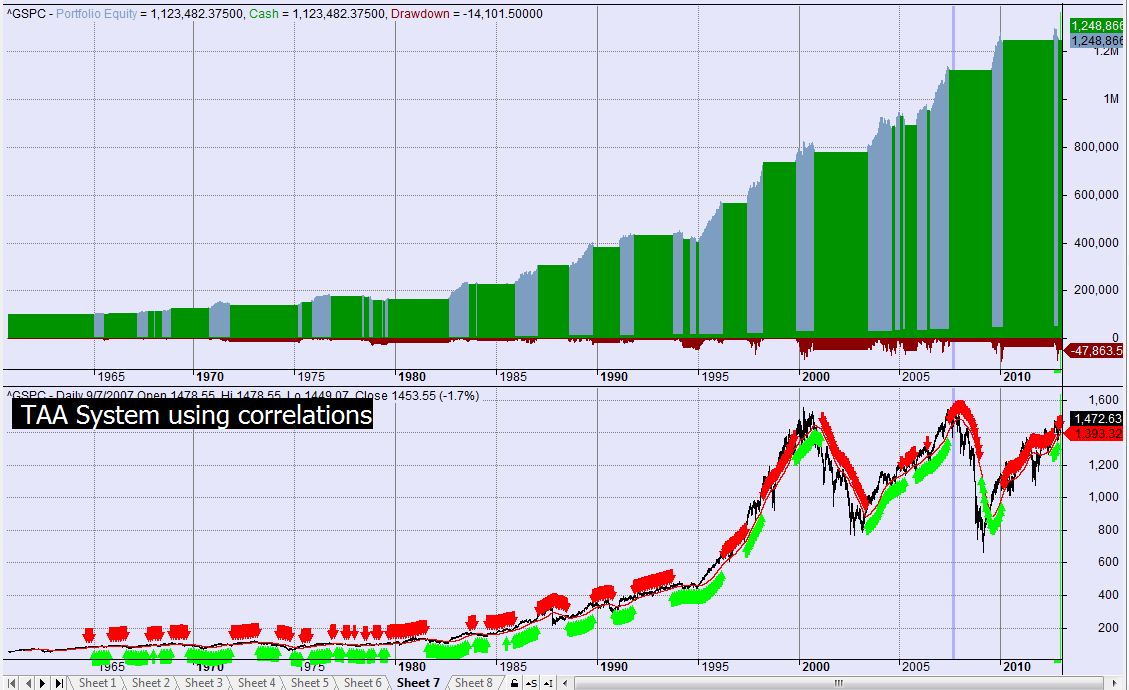
Just for fun let’s do the exact opposite: We will buy when the short term correlation is less than the long term one. Same parameters.
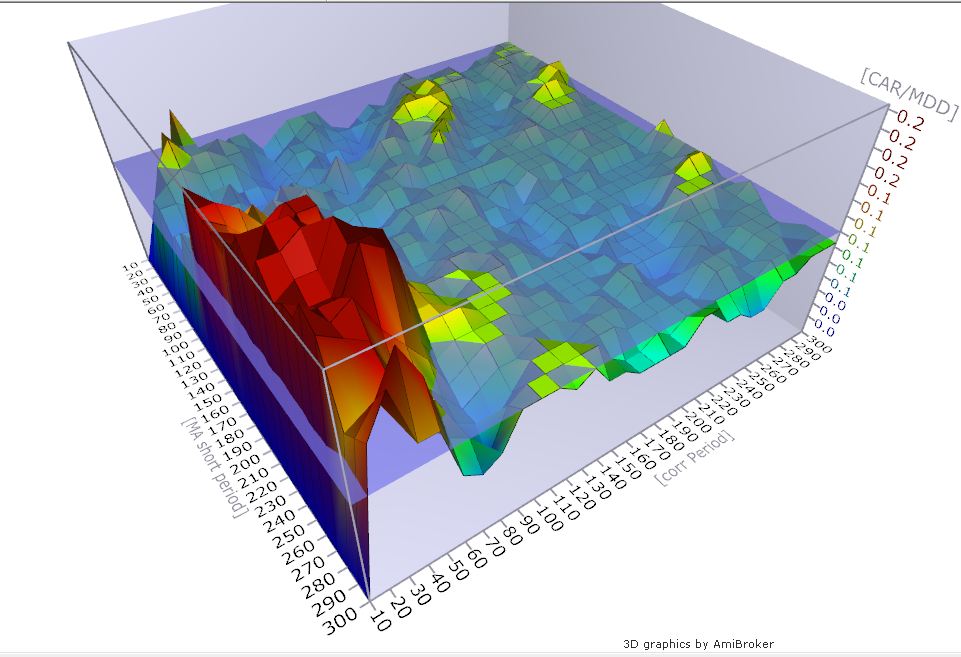
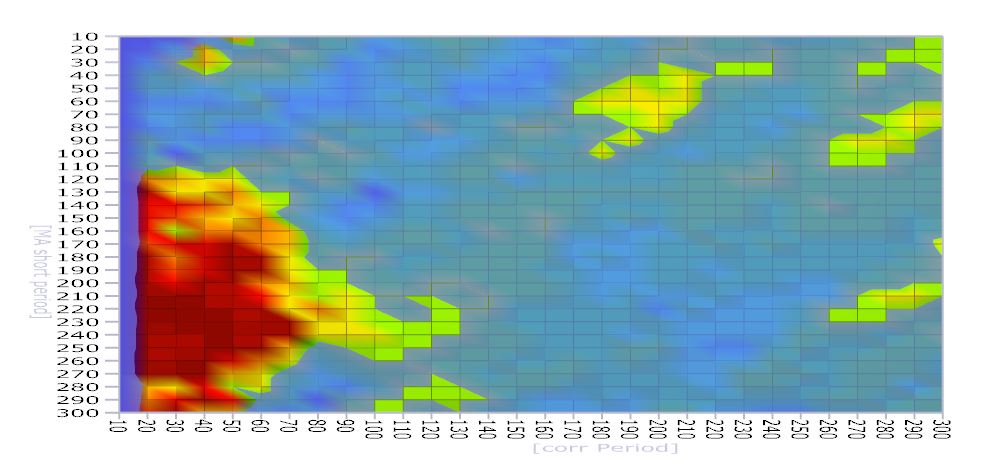
Let us optimize the parameters to get a better sense of what is happening. Is there a “general acceptable area”?
params: [10–>300 10–>300]
Using these optimized parameters, what would trading the 5 core etfs would look like? Risk on means buy SPY,EEM,EFA and VNQ. Risk off means buy IEF.
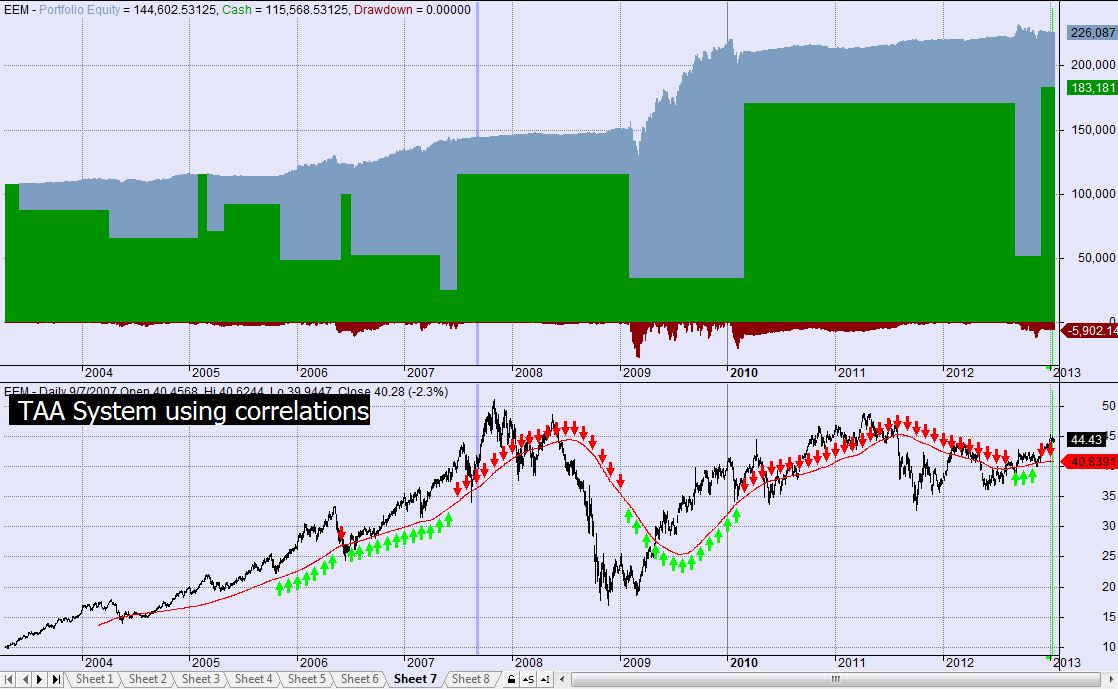
The equity is for the whole 5 -asset system. The lower pane shows the Emerging Markets time series (NYSEARCA:EEM).
You can see from the lower graph, this system did not buy EEM for the whole 2010-2013 period.
Going back to just trading the SP500, what would happen if we added the simple MA rule. Buy as before but only if price is above it’s 200-day moving average. Sell as before but also sell if price is less than it’s 200 moving average:
Disclaimer: This is a quick and dirty try-out of whether stock/bond correlation can help differentiate bull/bear regimes. It’s not meant to be precise but rather to get you started in performing your own tests.
Few thoughts on TAA:
I will caution the reader that when it comes to “TAA” strategies, for the past few years, holding both the S&P500 (SPY) and bonds (IEF) was an exceptional strategy whether you timed it or not. That is mostly due to the fact that IEF, the 10-year treasury proxy had both an exceptional run and a fairly uncorrelated one to the stock index. As others have mentioned, TAA systems may have a hard time delivering if Treasury yields stop dropping (below zero..?). But one way to look at the typical TAA strategy is that it is a diversified “short-the-dollar” strategy. Looking at it that way, there is room to diversify to non -U.S. denominates assets.

The code in Amibroker:
/
/----Code by Sanz P.-----------------------------------------------------//
newMonth=Month()!=Ref(Month(),-1);
MAperiods=Param("MA Periods",200,100,400,5);
AboveMA=C>MA(C,MAperiods);
BelowMA=C<MA(C,MAperiods);
spy=Foreign("^GSPC","C");
ief=1/Foreign("^TNX","C");
Corrperiod=Optimize("corr Period",40,10,300,10);
MAshort=Optimize("MA short period",220,10,300,10);
Corr=Correlation(spy,ief,Corrperiod);
MoreCorrelated=MA(Corr,MAShort)>MA(Corr,600);
if(Name()=="^GSPC")
{
Buy=MoreCorrelated AND newmonth;// AND abovema;
Sell=(!MoreCorrelated /*OR !abovema*/) AND newmonth;
}
/*
if(Name()=="IEF")
{
Buy=!MoreCorrelated AND newmonth ;
Sell=MoreCorrelated AND newmonth;
}
*/
PosQty =Param("How many Positions",1,1,20,1);
SetOption("MaxOpenPositions", PosQty );
SetTradeDelays(0,0,0,0);
BuyPrice=SellPrice=C;
PositionSize=-96/PosQty ;
Hi,
Very interesting. So is it correct to say..
1. Take 40 day correlation of GSPC and 1/TYX
2. Take 220 day moving average of step 1
3. Take 600 day correlation of GSPC and 1/TYX
4. If answer at step 2>answer step 3 go long?
5. If answer at step 2<answer step 3 go short?
I didn't quite follow this.
Cheers, M
Number 3 is incorrect. Here are the steps:
1. Take 40 day correlation of GSPC and 1/TYX
2. Take 220 day moving average of step 1
3. Take 600 day moving average of step 1
4. If answer at step 2>answer step 3 go long
5. If answer at step 2<answer step 3 go cash
Hi Sanz, Congrats for your blog, its very interesting.
Im newbie at AFL codding, and I´m trying to run this code but I can´t
Can you help me?
I paste this code on de formula editor:
//http://sanzprophet.com/2013/01/cba-quick-test-drive/
newMonth=Month()!=Ref(Month(),-1);
MAperiods=Param(“MA Periods”,200,100,400,5);
AboveMA=C>MA(C,MAperiods);
BelowMA=CMA(Corr,600);
if(Name()==”^GSPC”)
Buy=MoreCorrelated AND newmonth AND abovema;
Sell=!MoreCorrelated OR !abovema AND newmonth;
if(Name()==”IEF”)
Buy=!MoreCorrelated AND newmonth;
Sell=MoreCorrelated AND newmonth;
PosQty =Param(“How many Positions”,1,1,20,1);
SetOption(“MaxOpenPositions”, PosQty );
SetTradeDelays(0,0,0,0);
BuyPrice=SellPrice=C;
PositionSize=-96/PosQty ;