 One of the readers of this blog, Mark, alerted me to a new indicator/system published from Connors/Alvarez : The ConnorsRSI.
What is the ConnorsRSI?
It consists of three components:
a. Short term Relative Strength, i.e., RSI(3).
b. Counting consecutive up and down days (streaks) and “normalizing” the data using RSI(streak,2). The result is a bounded, 0-100 indicator.
c. Magnitude of the move (percentage-wise) in relation to previous moves. This is measured using the percentRank() function.
The formula given is:
ConnorsRSI(3,2,100) = [ RSI(Close,3) + RSI(Streak,2) + PercentRank(percentMove,100) ] / 3
Bottom line: Connors/Alvarez have used similar indicators in the past. What is happening here is that they are creating a more robust indicator by averaging the three. They are “normalizing” the three indicators (rsi, consecutive moves and magnitude of move) to a 0-100 range and then averaging.
Connors/Alvarez propose a strategy that uses the Connors RSI coupled with other rules and filters on large section of U.S. Stocks.
In this post we’ll test the indicator on one security only, the SPY etf (as a proxy for the SP500).
Test A –
Instrument – SPY
1. Using ConnorsRSI(3,2,100) – We ‘ll call it Crsi.
2. Buy on Crsi<15
3. Sell on Crsi>70
4. Buy /Sell on the next bar Open price.
5. Commision of $0.005.
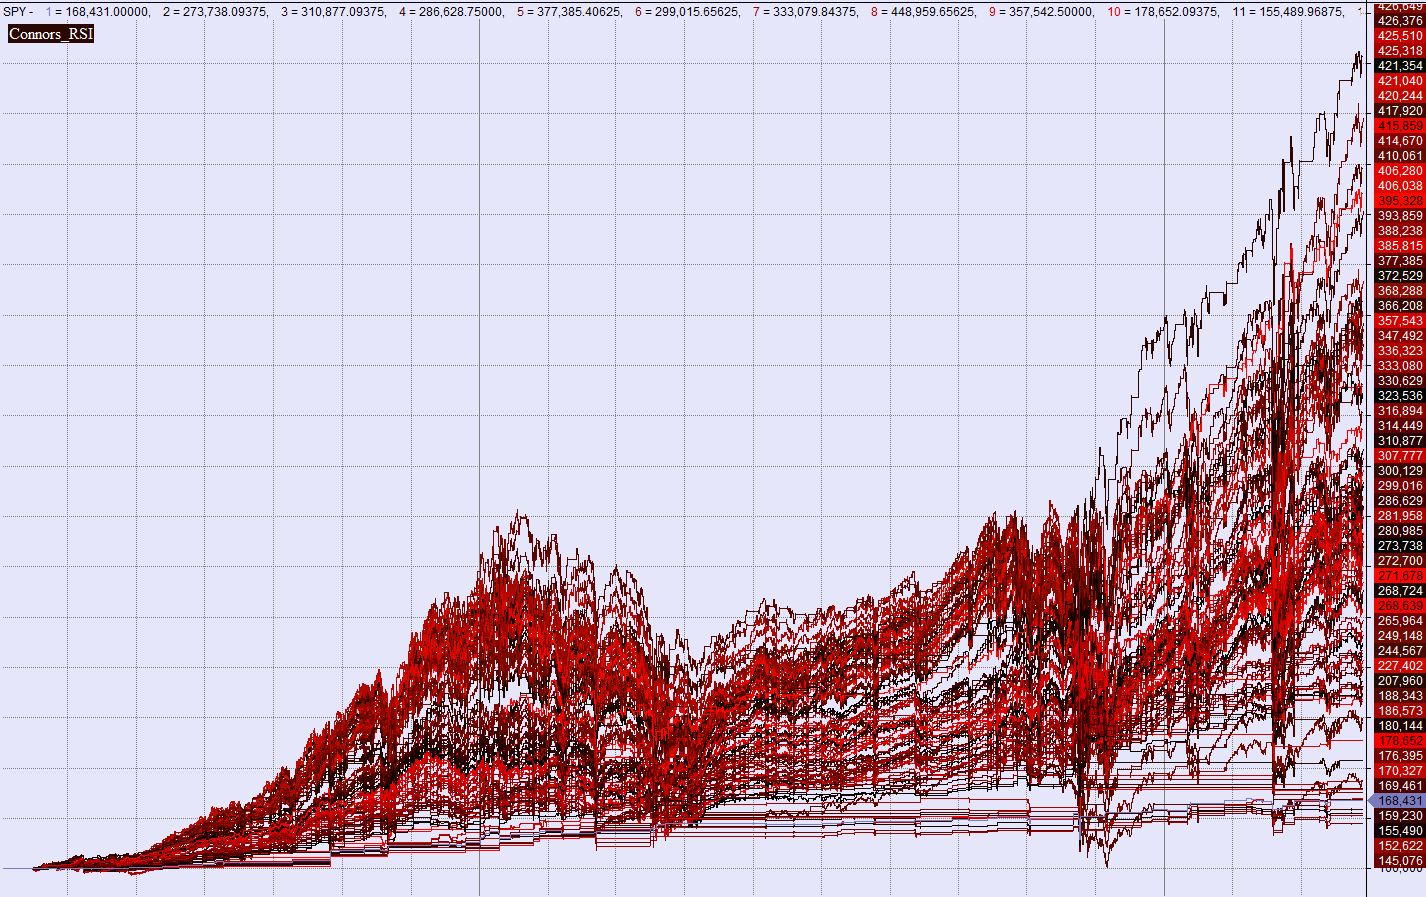
Test B –
The obvious question is whether the parameters are “fitted” to the data. What about using other parameters:
ConnorsRSI(a,b,c)
a–>2-4
b–>2-4
c–>80-140
BuyThreshold –>5-50
BuyThreshold –>50-95
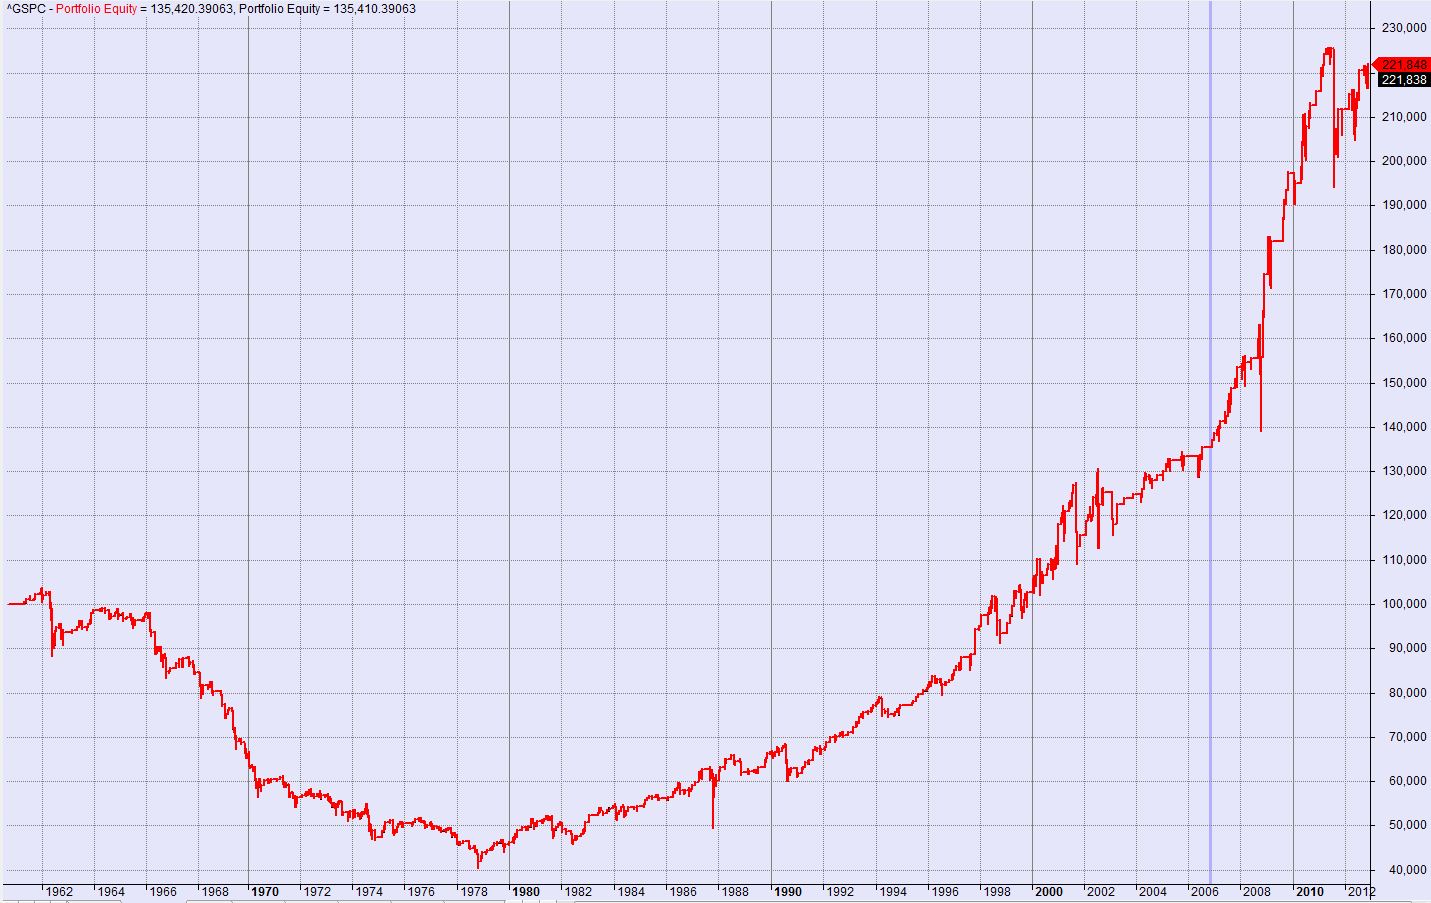
Test C –
What about before 1994? We ‘ll use ^GSPC (the SP500 Index).
Same parameters as “Test A”
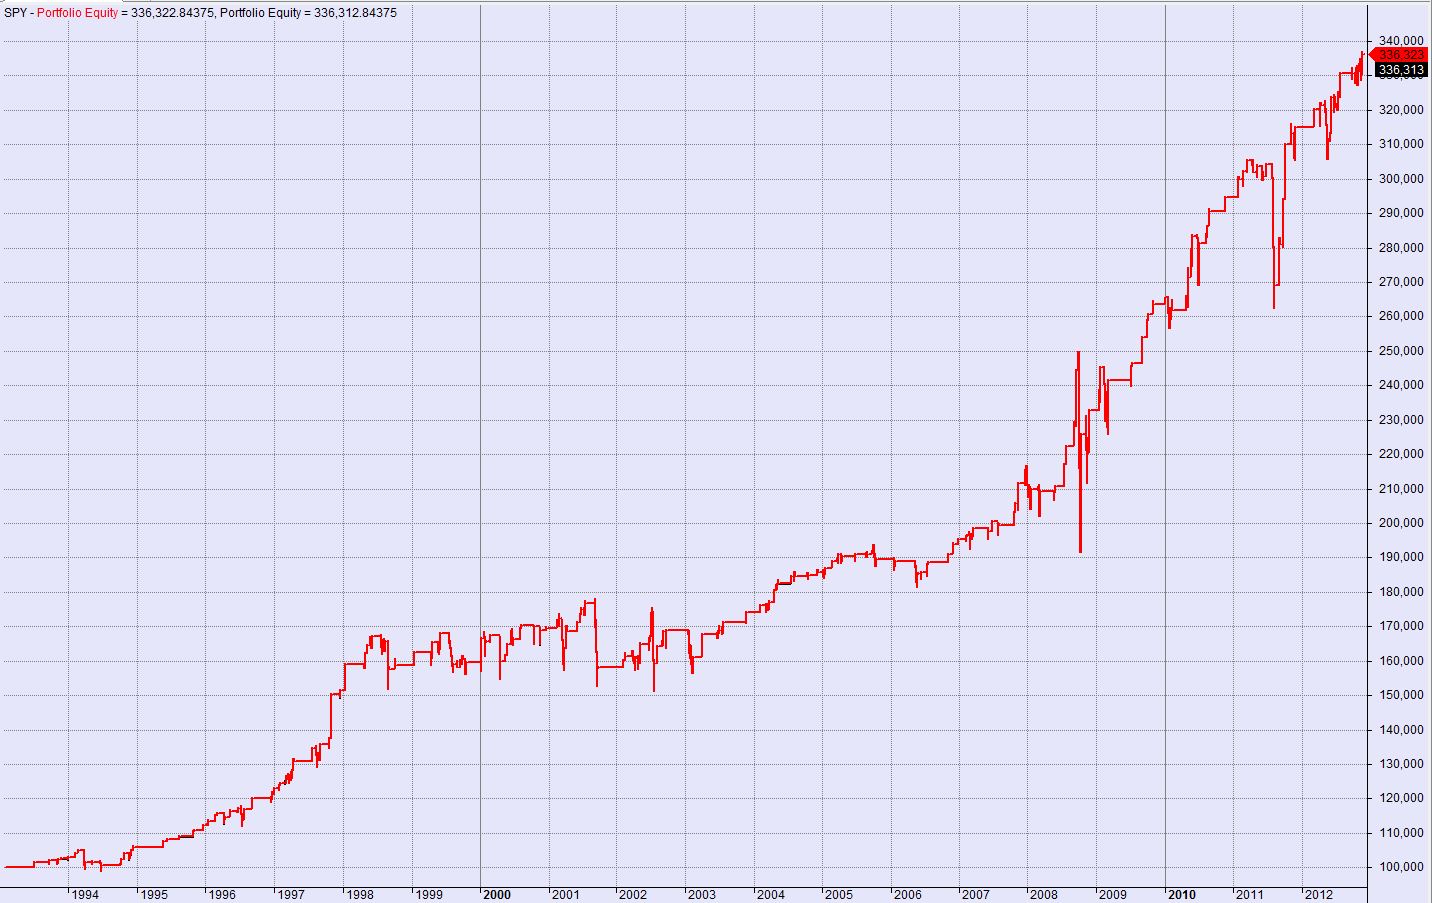
Detailed results Test A
All trades
Initial capital 100000
Ending capital 336322.84
Net Profit 236322.84
Net Profit % 236.32%
Exposure % 6.55%
Net Risk Adjusted Return % 3606.42%
Annual Return % 6.30%
Risk Adjusted Return % 96.17%
All trades 179
Avg. Profit/Loss 1320.24
Avg. Profit/Loss % 0.73%
Avg. Bars Held 4.77
Winners 136 (75.98 %)
Total Profit 439687.37
Avg. Profit 3233
Avg. Profit % 1.71%
Avg. Bars Held 3.93
Max. Consecutive 11
Largest win 15964.53
# bars in largest win 3
Losers 43 (24.02 %)
Total Loss -203364.52
Avg. Loss -4729.41
Avg. Loss % -2.37%
Avg. Bars Held 7.42
Max. Consecutive 3
Largest loss -35059.29
# bars in largest loss 10
Max. trade drawdown -58157.34
Max. trade % drawdown -23.75%
Max. system drawdown -58157.34
Max. system % drawdown -23.28%
Recovery Factor 4.06
CAR/MaxDD 0.27
RAR/MaxDD 4.13
Profit Factor 2.16
Payoff Ratio 0.68
Standard Error 20256.9
Risk-Reward Ratio 0.5
Ulcer Index 3.5
Ulcer Performance Index 0.26
Sharpe Ratio of trades 2.23
K-Ratio 0.0404
Thank you for this post. How do did you code the RSI(Streak, 2)?
Thank you.
One way to do it, in Amibroker AFL code:
up=C>Ref(C,-1);
dn=C<Ref(C,-1);
ChangeSIgn=(up AND !Ref(up,-1)) OR (dn AND !Ref(dn,-1));
Seqbars=BarsSince(ChangeSign)+1;
streak=Sum(up,Seqbars)-Sum(dn,Seqbars);
streakRSI=RSIa(streak,2);
Thank you. So if I understand your code correctly, the streak is a positive or negative number from when the streak starts to when it ends.
Nice work! I was looking around for the code for this and stumbled upon your blog instead. I am enjoying reading your blog.
@Anonymous:
That's right. If today it's a down day, it counts as -1 and keeps going -2,-3, until an upday. That First Upday is counted as +1.
@Woodshedder
Thank you! I have enjoyed reading your blog for some time now. If you need the code I 'll be happy to share.
Sanz Prophet, that would be very cool, and I would be most appreciative. I sent an email to your gmail.
I think you need to add one more piece to the code. If the stock price doesn't change, then the streak count resets. Down days are -1, up days are +1, but no change is 0
up=C>Ref(C,-1);
dn=C<Ref(C,-1);
Co = C==Ref(C,-1);
ChangeSIgn=(up AND !Ref(up,-1)) OR (dn AND !Ref(dn,-1) OR (Co AND !Ref(Co,-1)));
You can verify the cRSI values on their website.
Thank you. I'm having some trouble understanding how to calculate the Streak RSI. I get how to calculate a any rsi based on a close but how do you calculate the RSI of a streak.
Any help is appreciated. Thank you!!
@Chris
Thank you for the input Chris. The code works well. Appreciate it.
@Anonymous
the RSI is just a transformation. It takes a series of data (an array), usually the close price and projects it into a 0-100 oscillator. Instead of feeding the Close price we could feed it other data, like the streak array.
If you use Amibroker use the RSIa(array,period) function: normStreak=RSIa(streakRSI,2).
Otherwise you can find the RSI calculation logic and just use Streak values instead of the stock price value.
http://stockcharts.com/school/doku.php?id=chart_school:technical_indicators:relative_strength_index_rsi
http://www.amibroker.com/guide/afl/afl_view.php?id=125
@ Sanz Prophet
Thank you. I have no problem calculating an RSI based on close, high, low etc. You take the average gain and loss for the chosen period and then you calcualte the RSI. What I fail to understand is the technicality for the streak RSI. Based on the excel sheet in the link you provided above, could you give me an example on how you calculate the RSI? I would really appreciate that.
P.S. I use NinjaTrader for my strategies.
@Anonymous
Based on the Excel sheet, you would substitute the QQQQ close values with the Streak Indicator
values. Feel free to e-mail me for more details.
I have also been trying to properly calculate the RSI(streak,2). I use Omnitrader, but for simplicity I've coded the calculations in an Excel spreadsheet. I was operating under the assumption that positive streak values are treated as "gains" and negative streaks as "losses" in an RSI(2) calculation. I have been in contact with Connors Research and have tried to get them to tell me where I am going wrong. They confirmed that I get the streak calculation correct, but somehow the resultant RSI value is not in agreement with what they claim, thus the CRSI value is wrong as well. The guy there has tried to be helpful by sending me some historical data on the components, but he doesn't seem to be fluent in the mechanics of the calculation and their technical folks are too busy to help right now. I have a well documented spreadsheet I can send for inspection.
It came to me at 3:30 this morning. I had interpreted the streak values as being plugged into the gain or loss calculation of RSI, and it didn't work. What you are saying is treat the streak values as if they were close values when doing the RSI calculation, i.e. gain or loss = today's streak value – yesterday's streak value. That gave me correct results. Thanks much. You helped me resolve what I had been emailing back and forth for 3 days with the Connors folks.
@Steven
Glad to be of help 🙂
@ Sanz Prophet
Thank you. Where can I find your email address?
sanzprophet at gmail dot com or hit the "E-mail me" link on the right side of the main page (under "Followers").
Excellent. Thanks.
Could you please provide teh complete code for ConnorsRSI with rules defined by Connors i.e. Low has to be < X% from previous close and ADX(10) > 30 with volume (21) > 250,000. Buy limit order at X% below trigger date and Sell when CRSI > X%.
The 'official' ConnorsRSI code is available on the Amibroker online library compliments of the authors themselves..
@Steven
Could you please send me your excel with the streak calculations to pascal(dot)deplancke(at)hotmail(dot)be
thanks
Hi Sanz,
I will really appreciate if you can send me the excel for Connors RSI calculation. I have been bugging my head on it for quite sometime but the values for CRSI I am getting are not correct.
Thanks in advance.