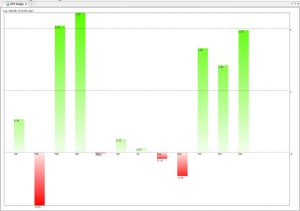
Here’s the strategy: Each month we buy at the Open of the first day of the month and sell at the close of the last day of the month. Here’s the average profit loss for the S&P500 Etfs, SPY (yahoo:SPY). Data from 1993. This chart shows that for example if we bought every December @ …
Archives for December 2012
Connors RSI – Part 1

One of the readers of this blog, Mark, alerted me to a new indicator/system published from Connors/Alvarez : The ConnorsRSI. What is the ConnorsRSI? It consists of three components:a. Short term Relative Strength, i.e., RSI(3).b. Counting consecutive up and down days (streaks) and “normalizing” the data using RSI(streak,2). The result is a bounded, 0-100 indicator.c. Magnitude of the move …