
Here’s a couple of simple mean reverting strategies using a short term RSI (Relative Strength Index) , trading the ^GSPC index. They buy on oversold and sell on overbought. Long only.
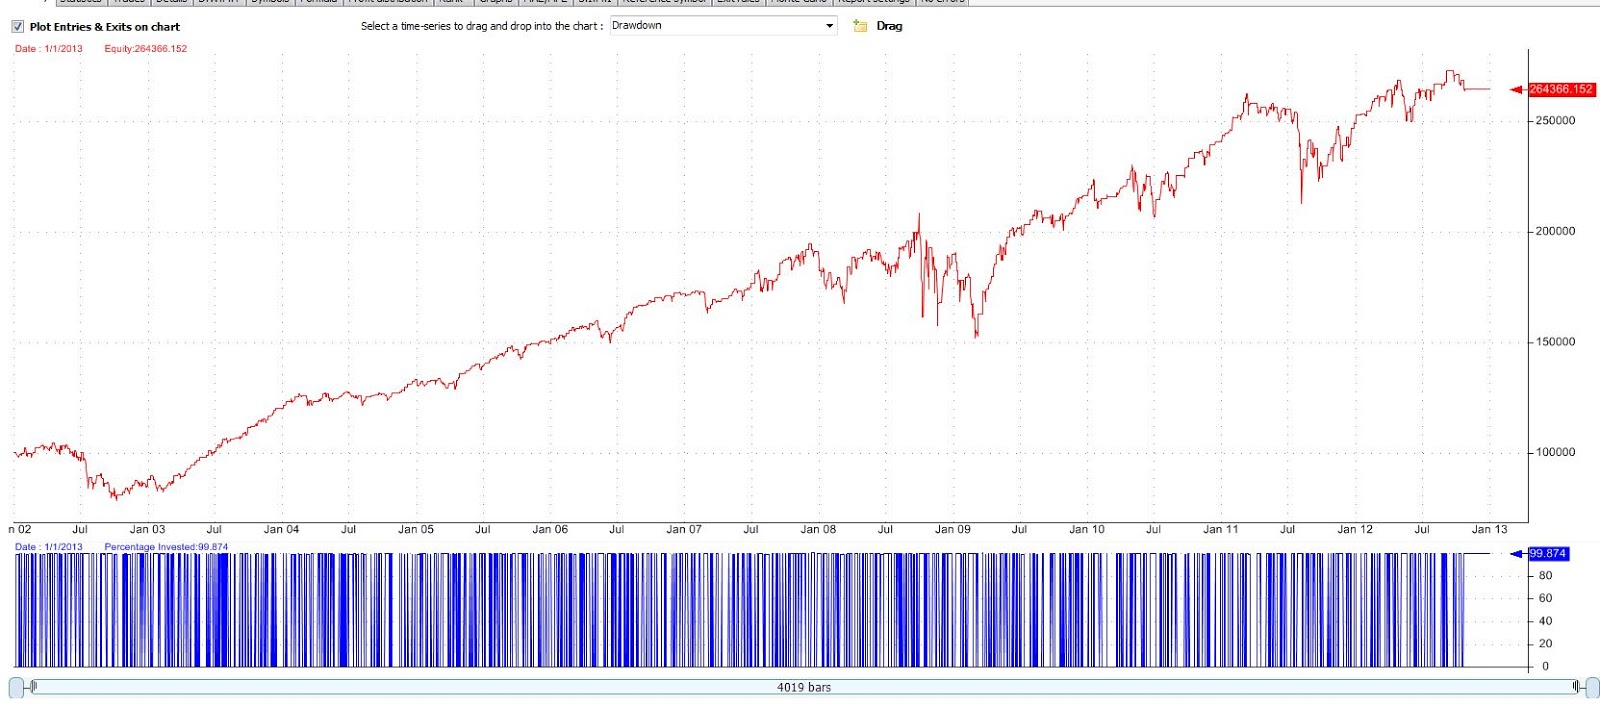

Looks nice, doesn’t it? We barely see the 2008-2009 draw-down that Buy-N-Hold suffered.
There is a “but”…
Look at the same strategy starting in 1960:
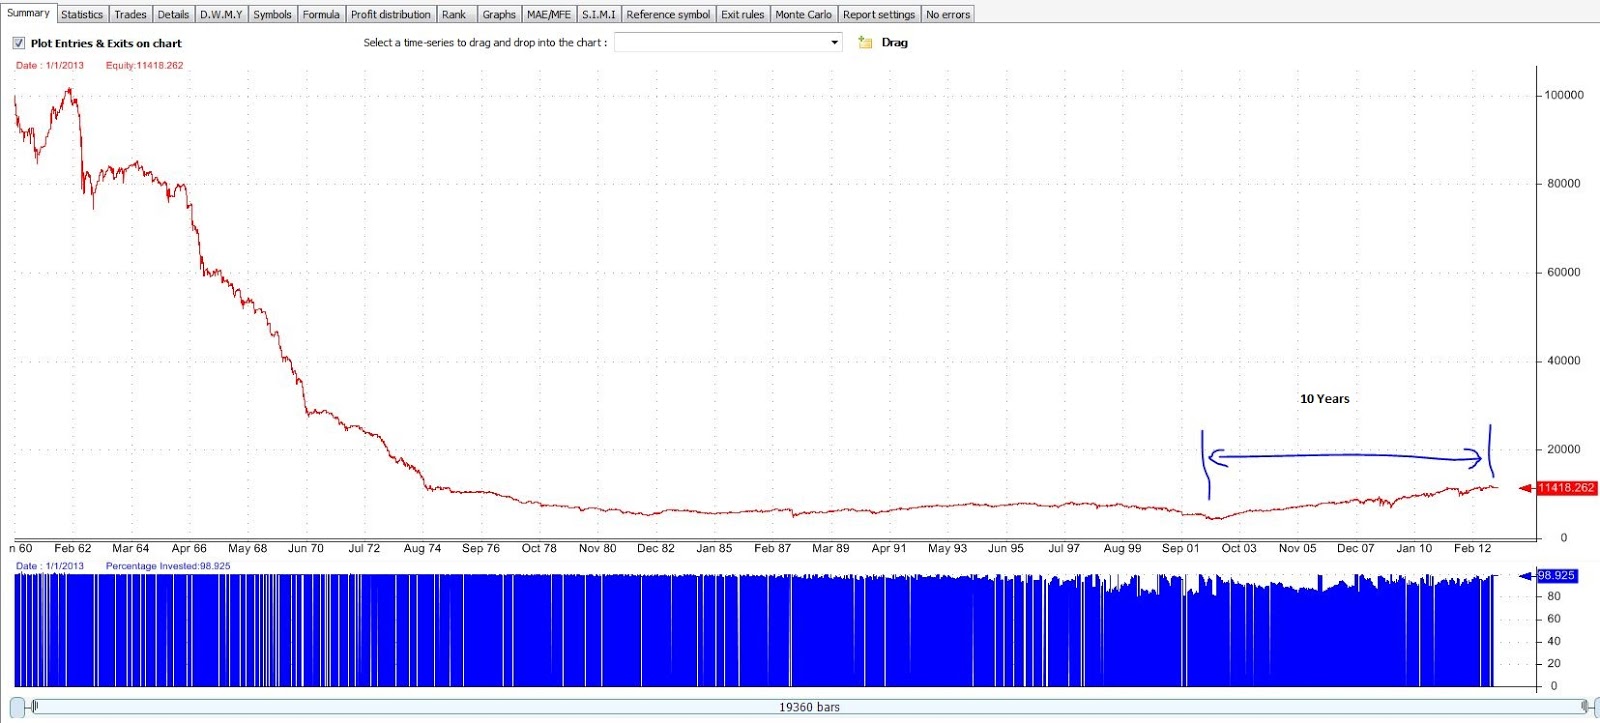
This is telling us that for the last 10 years the market has changed and has become mean reverting. There might be fundamental reasons for this and although it is unlikely the market will return to pre-2000 behavior, it is not inconceivable.
Let’s say we traded the oposite strategy. Buy if short term RSI is high, sell if it’s low.

As expected, it does well up to 2000, then it’s a disaster. Notice that for the period 2010-2012, it has not performed as badly as expected. Others on the blog-o-spere have mentioned this: Mean-reverting strategies have not performed as well starting 2010.
 So knowing what we now know, how would an adaptive strategy work.
The Master strategy Includes:
A. 6 Mean Reversion strategies:
Instead of deciding on which RSI period and thresholds to use, we use 6 different versions (RSI(2), RSI(3) and RSI(4), each with different thresholds).
2. One Non-Mean-Revting strategy: If RSI(2) crosses 50 up then buy. If it crosses below, sell.
Allocation Rules:
We measure risk adjusted performance for the last 600 bars for each of the 7 strategies. The top 5 get allocated capital;
Best gets 50% of account to trade with
2nd gets 40. 3rd gets 30, etc.
Total allocation is 150%, meaning if all strategies were trading we would have to use 1.5x leverage.

In the second pane, the graph represents positions taken by the trend-following strategy.
In the third pane, the graphs represent positions taken by the various mean reverting strategies.
Up to 2002 the system takes positions mostly in the trend following strategy while starting as early as 1996 mean-reverting strategies start increasing positions and eventually take over by 2004.
Keep in mind that although the graph looks great, there is a 3 year period (2000-2003) of continuous draw-down as the environment changes and the strategy tries to adapt.
You may also notice that the “trend-following” RSI strategy (buy on up, sell on down) briefly started traded in August 2011, after being inactive for 9 years… Something to think about.
Thanks for the post. The way the performance of both mean reverting and trend following strategies are analyzed side-by-side is really eye opening.
On a regular basis, traders should perform a statistical analysis of their past X trades to determine if each trading system is still working. As Howard Bandy would say, in relation to a trading system you have to ask yourself "Is it broken?". If it is broken, stop trading it. You can still monitor paper trades to determine if the system starts working again. By engaging in this process, you have an adaptive trading strategy.
It's great to see an actual tangible and testable system posted on a blog, rather than all the usual untestable nonsense that is allover the Internet.
My experiments have shown me that mean reversion works on indices (which are driven by speculators buying low and selling high) and therefore constantly become over bough and over sold and then 'correct' themselves as they revert back to their means. Whilst currencies are driven by government and central bank polices more than anything else and therefore trend in the long-term.
Nice post. Interesting how even a composite system (mean reversion and trend following) experiences lengthy drawdowns up to three years. Thanks
Thanks for a great read. Every one has to made investments according to his financial possibilities, of course, and advices he may get from not involved advisors.
Hi Sanz,
Larry Swedroe published an article on Markowitz' analysis of market vs gambling behavior to see if market momentum/value anomalies are explained by behavior. (conclusion: behavior).
Markowitz listed one of the reasons for trend following persisting as the inability for arbitrageurs to get rid of it (commissions, other costs). That statement made me think of this analysis that you posted here.
You note that mean reversion picked up in 2002/3 after some wobbling to get in the preceding years. Well, decimalization came to the NYSE in 2001. MR was finally exploitable on a short term basis. An thus the picture we see above. My hypothesis anyway.
Now, low commissions, on a relative basis to the equity markets, have been a fact in the futures markets forever. And trending has survived there. My sense is we saw a shift in equities because of the market structure shift, and that it will stabilize again once the MR money is arbed out – which it appears to be doing.
Anyway, thought I'd share a connection to you past work.
BTW, you should still post insights here despite being with LogicInvest.
Moskowitz, not Markowitz…
Grateful to check out your website, I seem to be ahead to more excellent sites and I wish that you wrote more informative post for us. Well done work.
i appricaite your work this is really incredible i have get a lot of information from here thanks for
providing such kind of information.
momentum trading